Why digitalisation matters
Digitalisation has been a key topic for many years, if not decades. Its impact on a company’s prospects is regarded with varying degrees of seriousness by corporates and investors.

Caroline Keen
Portfolio Manager J.P. Morgan Asset Management
Alex Stanic
Portfolio Manager J.P. Morgan Asset Management
Key takeouts
- A significant divide remains between digital leaders and laggards in the corporate world, despite the intensified focus on digitalisation resulting from the Covid-19 pandemic.
- An in-depth analysis of a selection of companies shows that digital leaders are growing at almost five times the rate of the digital laggards.
- Comparing sport apparel companies Nike and Asics shows that Nike’s foresight in investing in digitalisation before its rival has delivered better revenue and profitability metrics.
- Given our focus on growth and quality, along with our digitalisation theme, we consider some of the best investment opportunities available to global investors today lie in investing in both traditional and new businesses that continue to embrace digitalisation.
The Covid-19 pandemic intensified the focus on digitalisation as the world’s interactions – social, transactional, professional, medical, financial, and educational – had to move online to survive. Still, we argue a huge divide persists between the digital leaders and the digital laggards in the corporate world and that understanding this is necessary both for investors’ decisions and corporates’ future growth and returns. Within our Digital Revolution theme, we look at the differences between these two groups of companies and draw some important conclusions about why digitalisation matters.
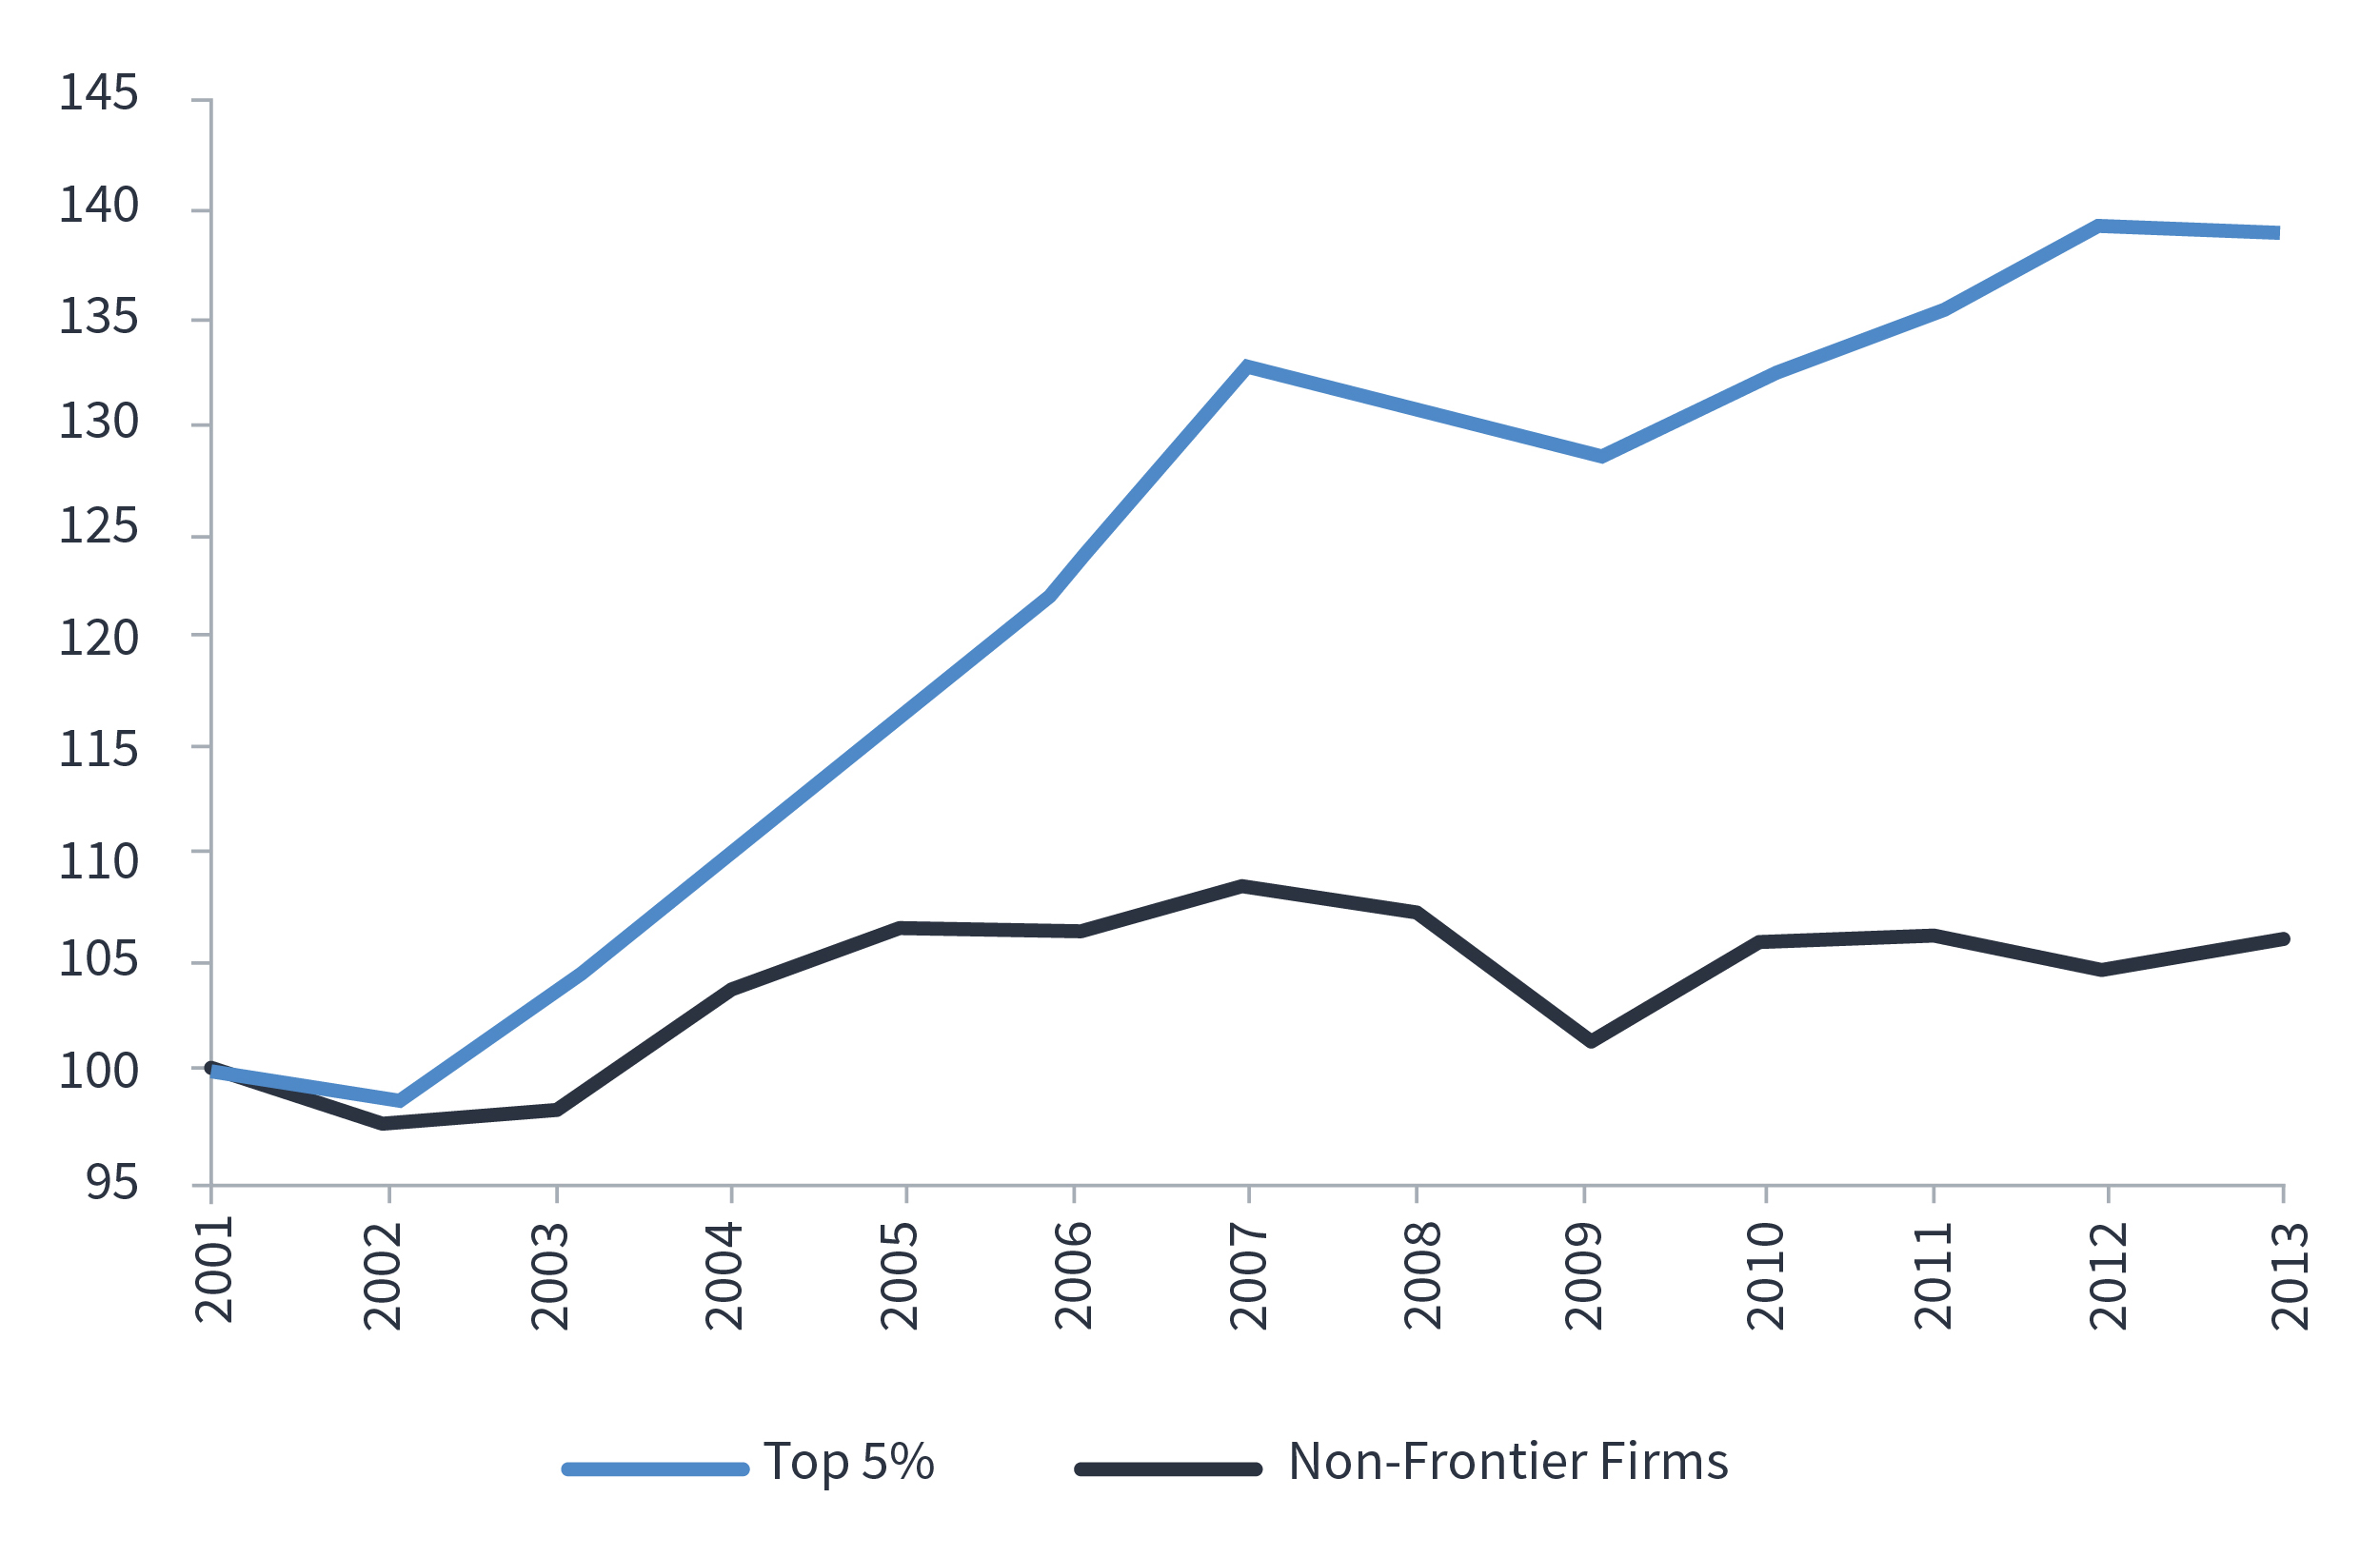
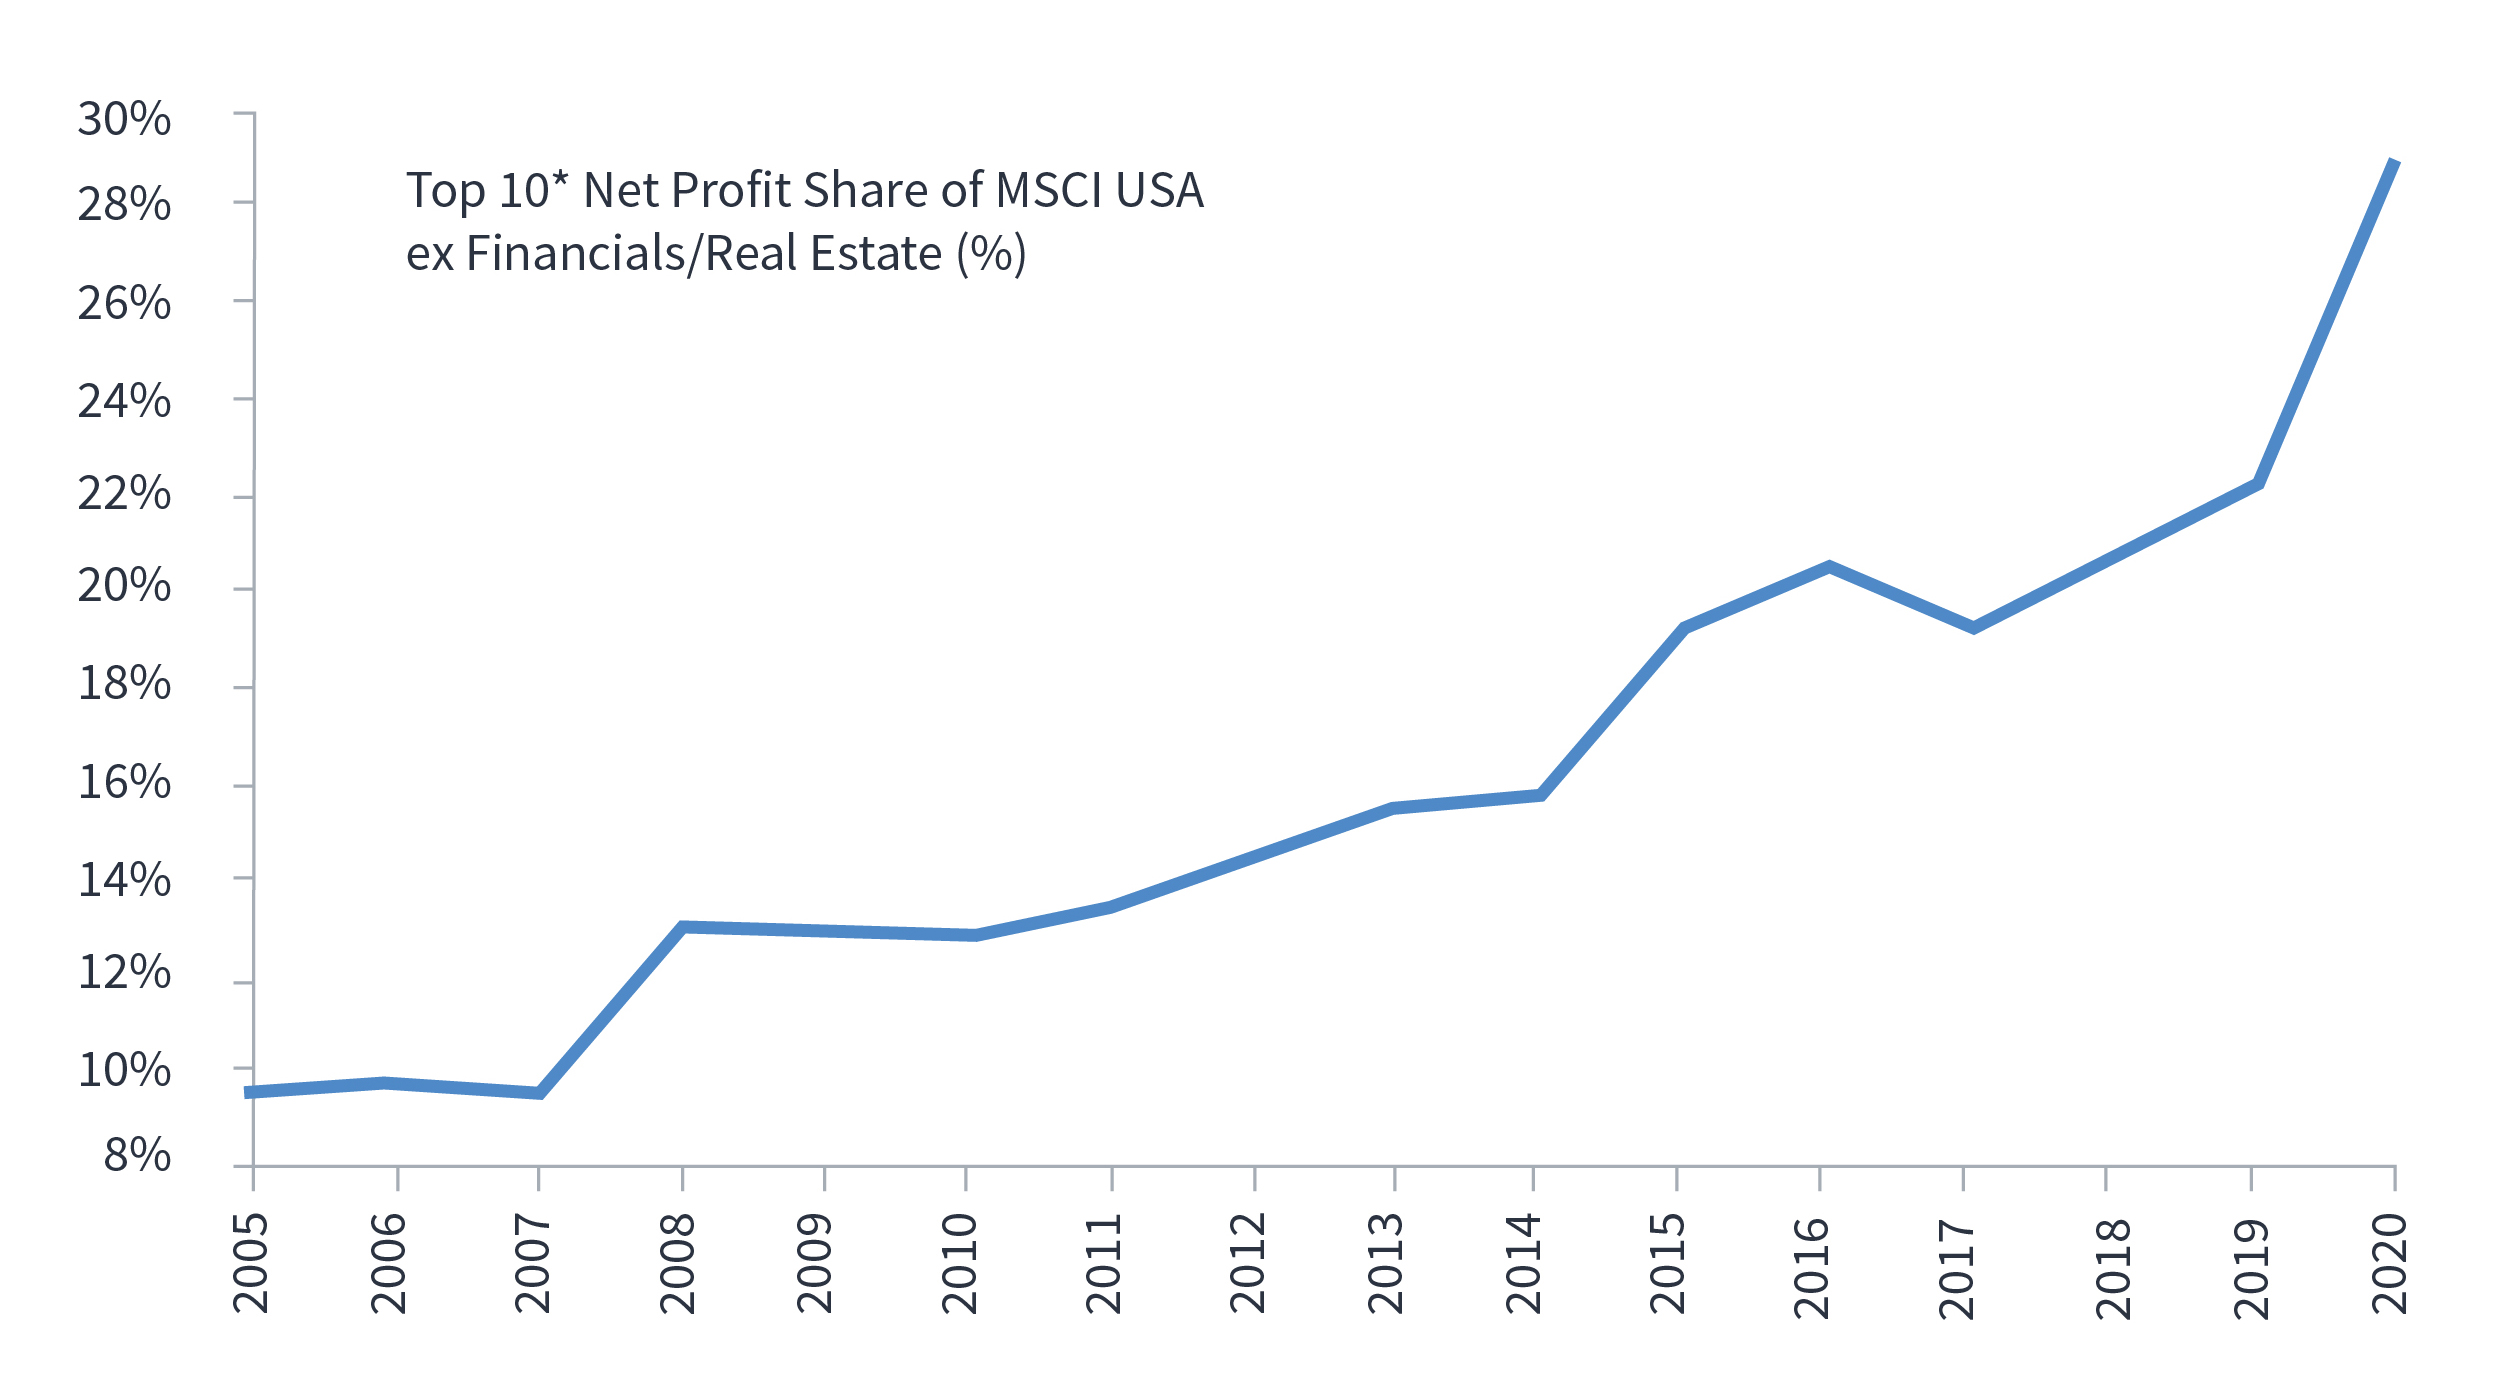
Firstly, taking a step back, we know that only a handful of exceptional companies have dominated stock market returns and corporate profitability for several years. These two charts from Macquarie make this argument very clearly. They show the productivity of the top 5% of productivity generators compared with the rest and that the profit contribution of the top 10 companies in the MSCI USA index has risen from 10% in 2005 to 30% in 2020.
Productivity gap – top 5% vs the non frontier (frontier ex top 5% productivity generators)
MXUS – Top 10 share of profits (%)
– up from 10% in 2005 to 30% in 2020
Source: OECD; Macquarie Research, April 2021
*Top 10 AAPL, MSFT, GOOGL, FB, JNJ, INTC, VZ, AMZN, ABBV, PFE Source: Factset; MSCI; Macquarie Research, April 2021
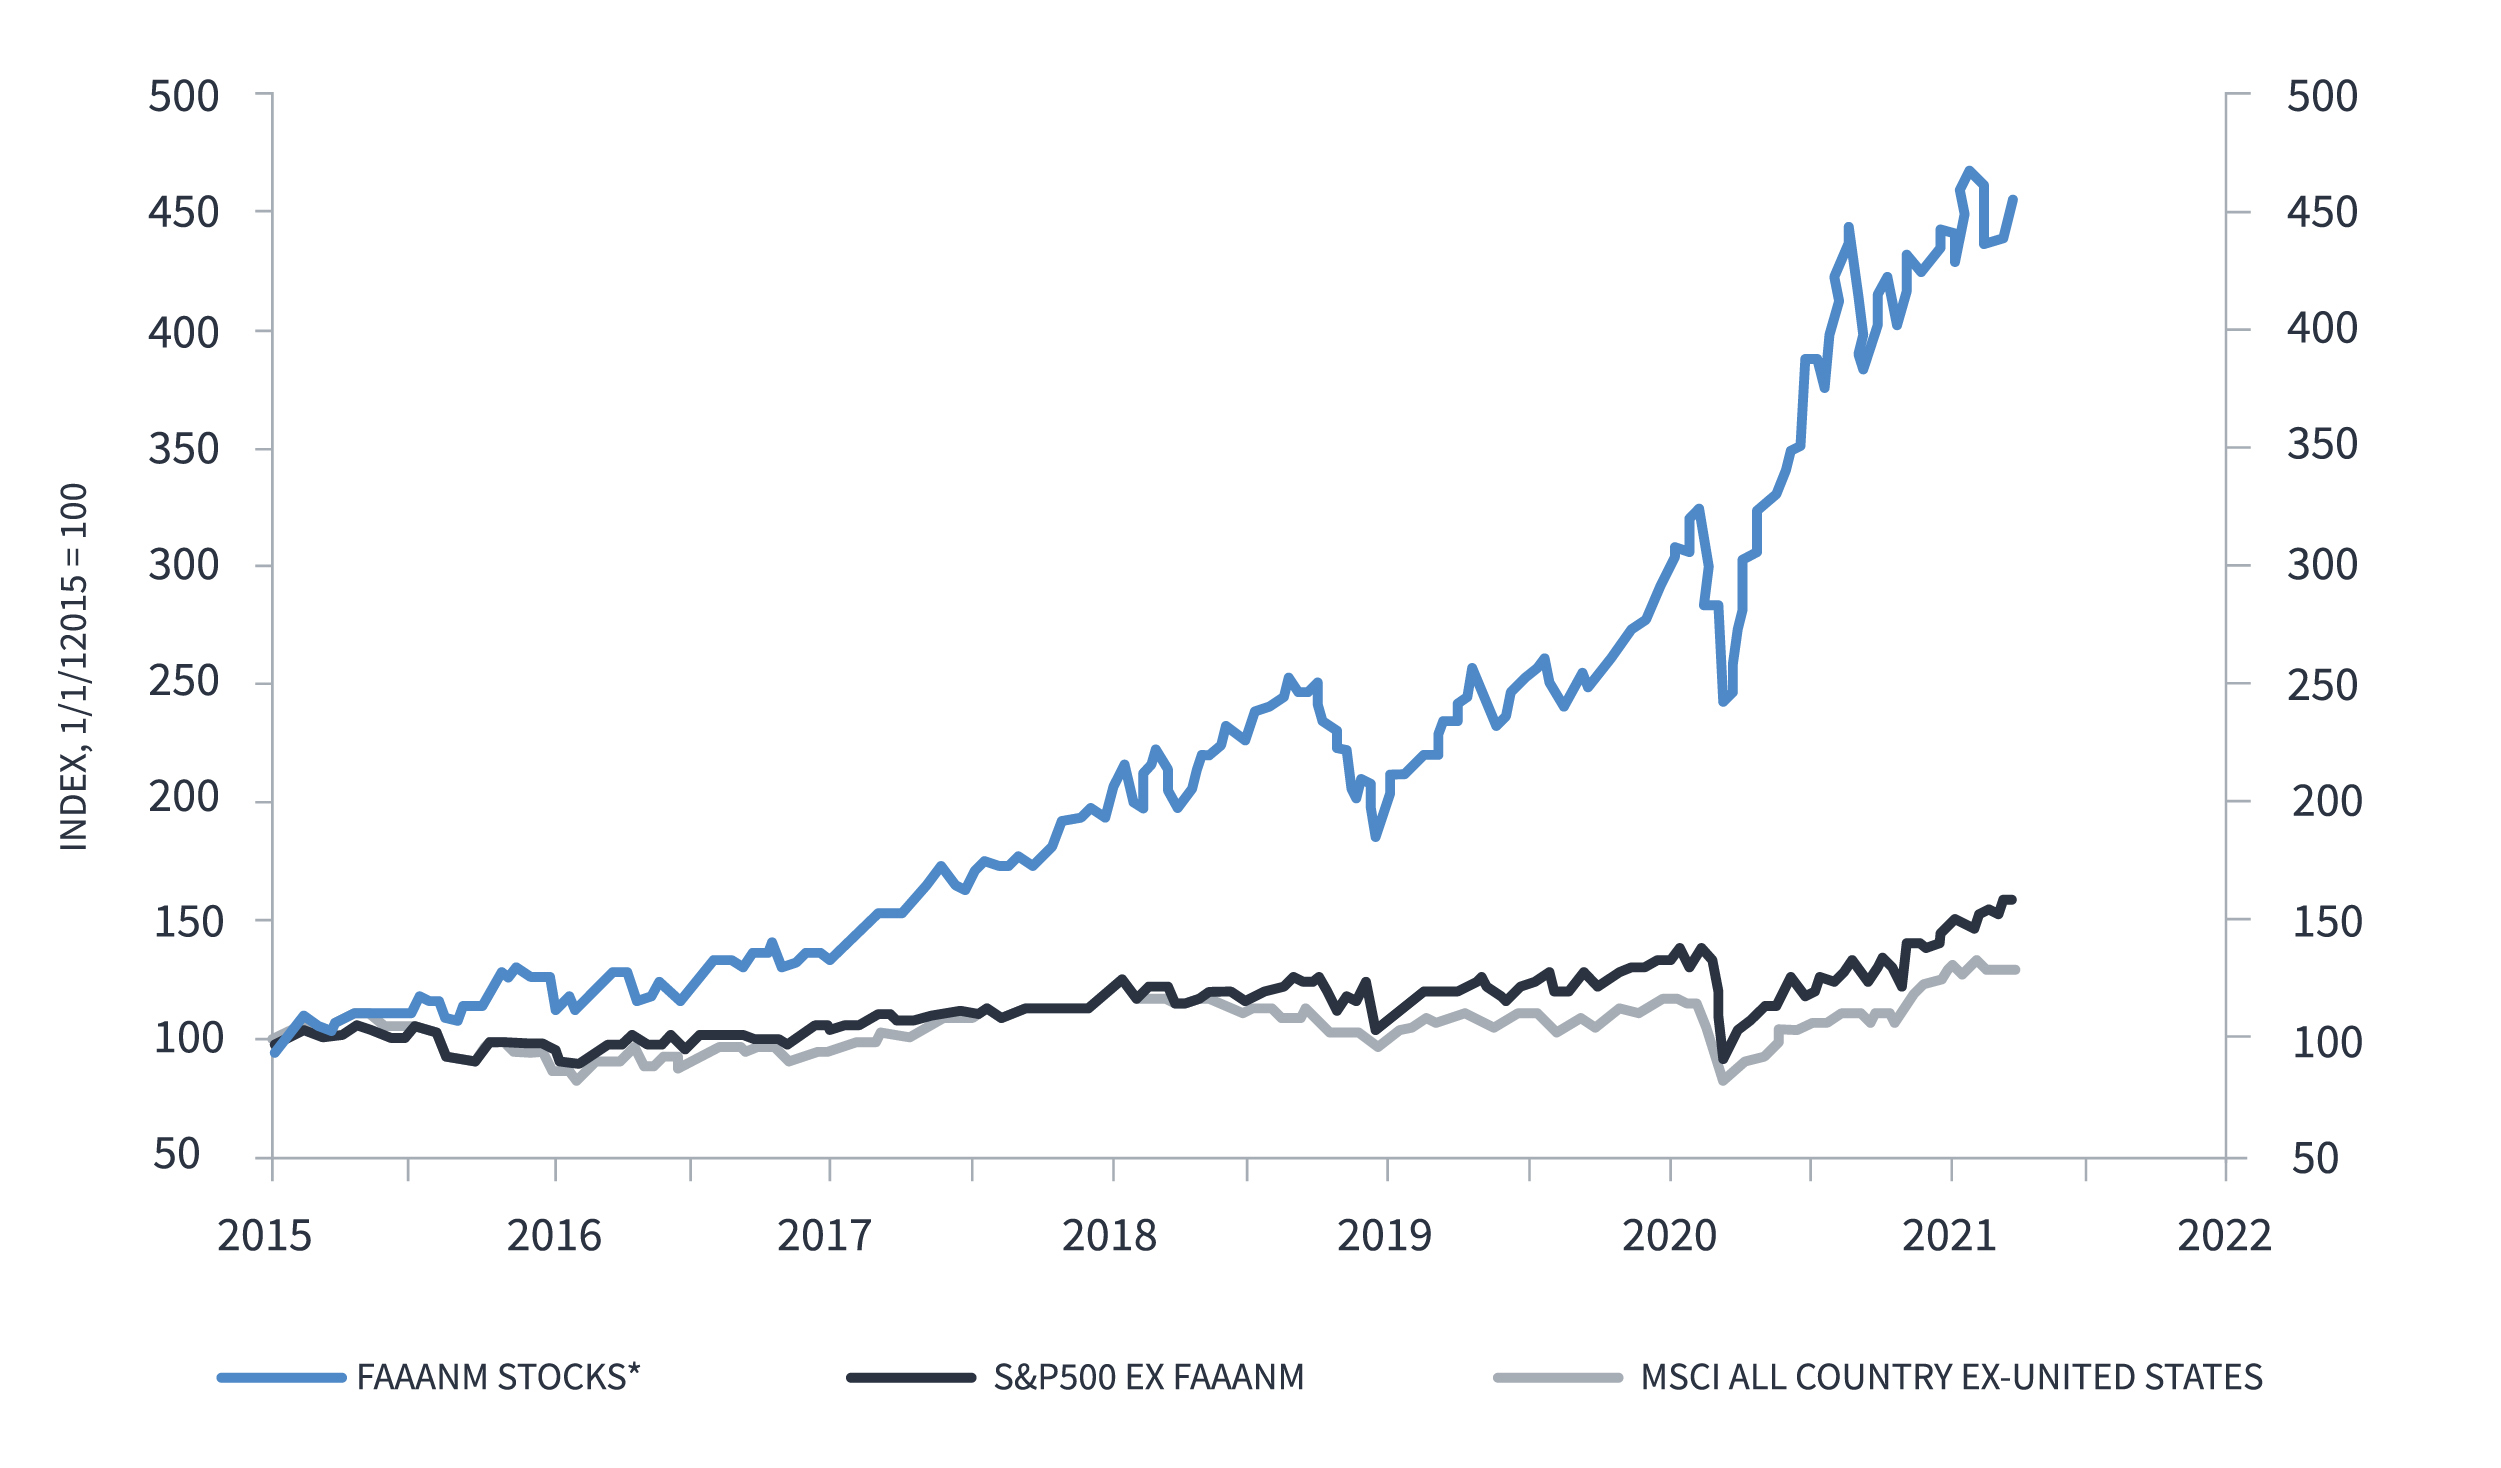
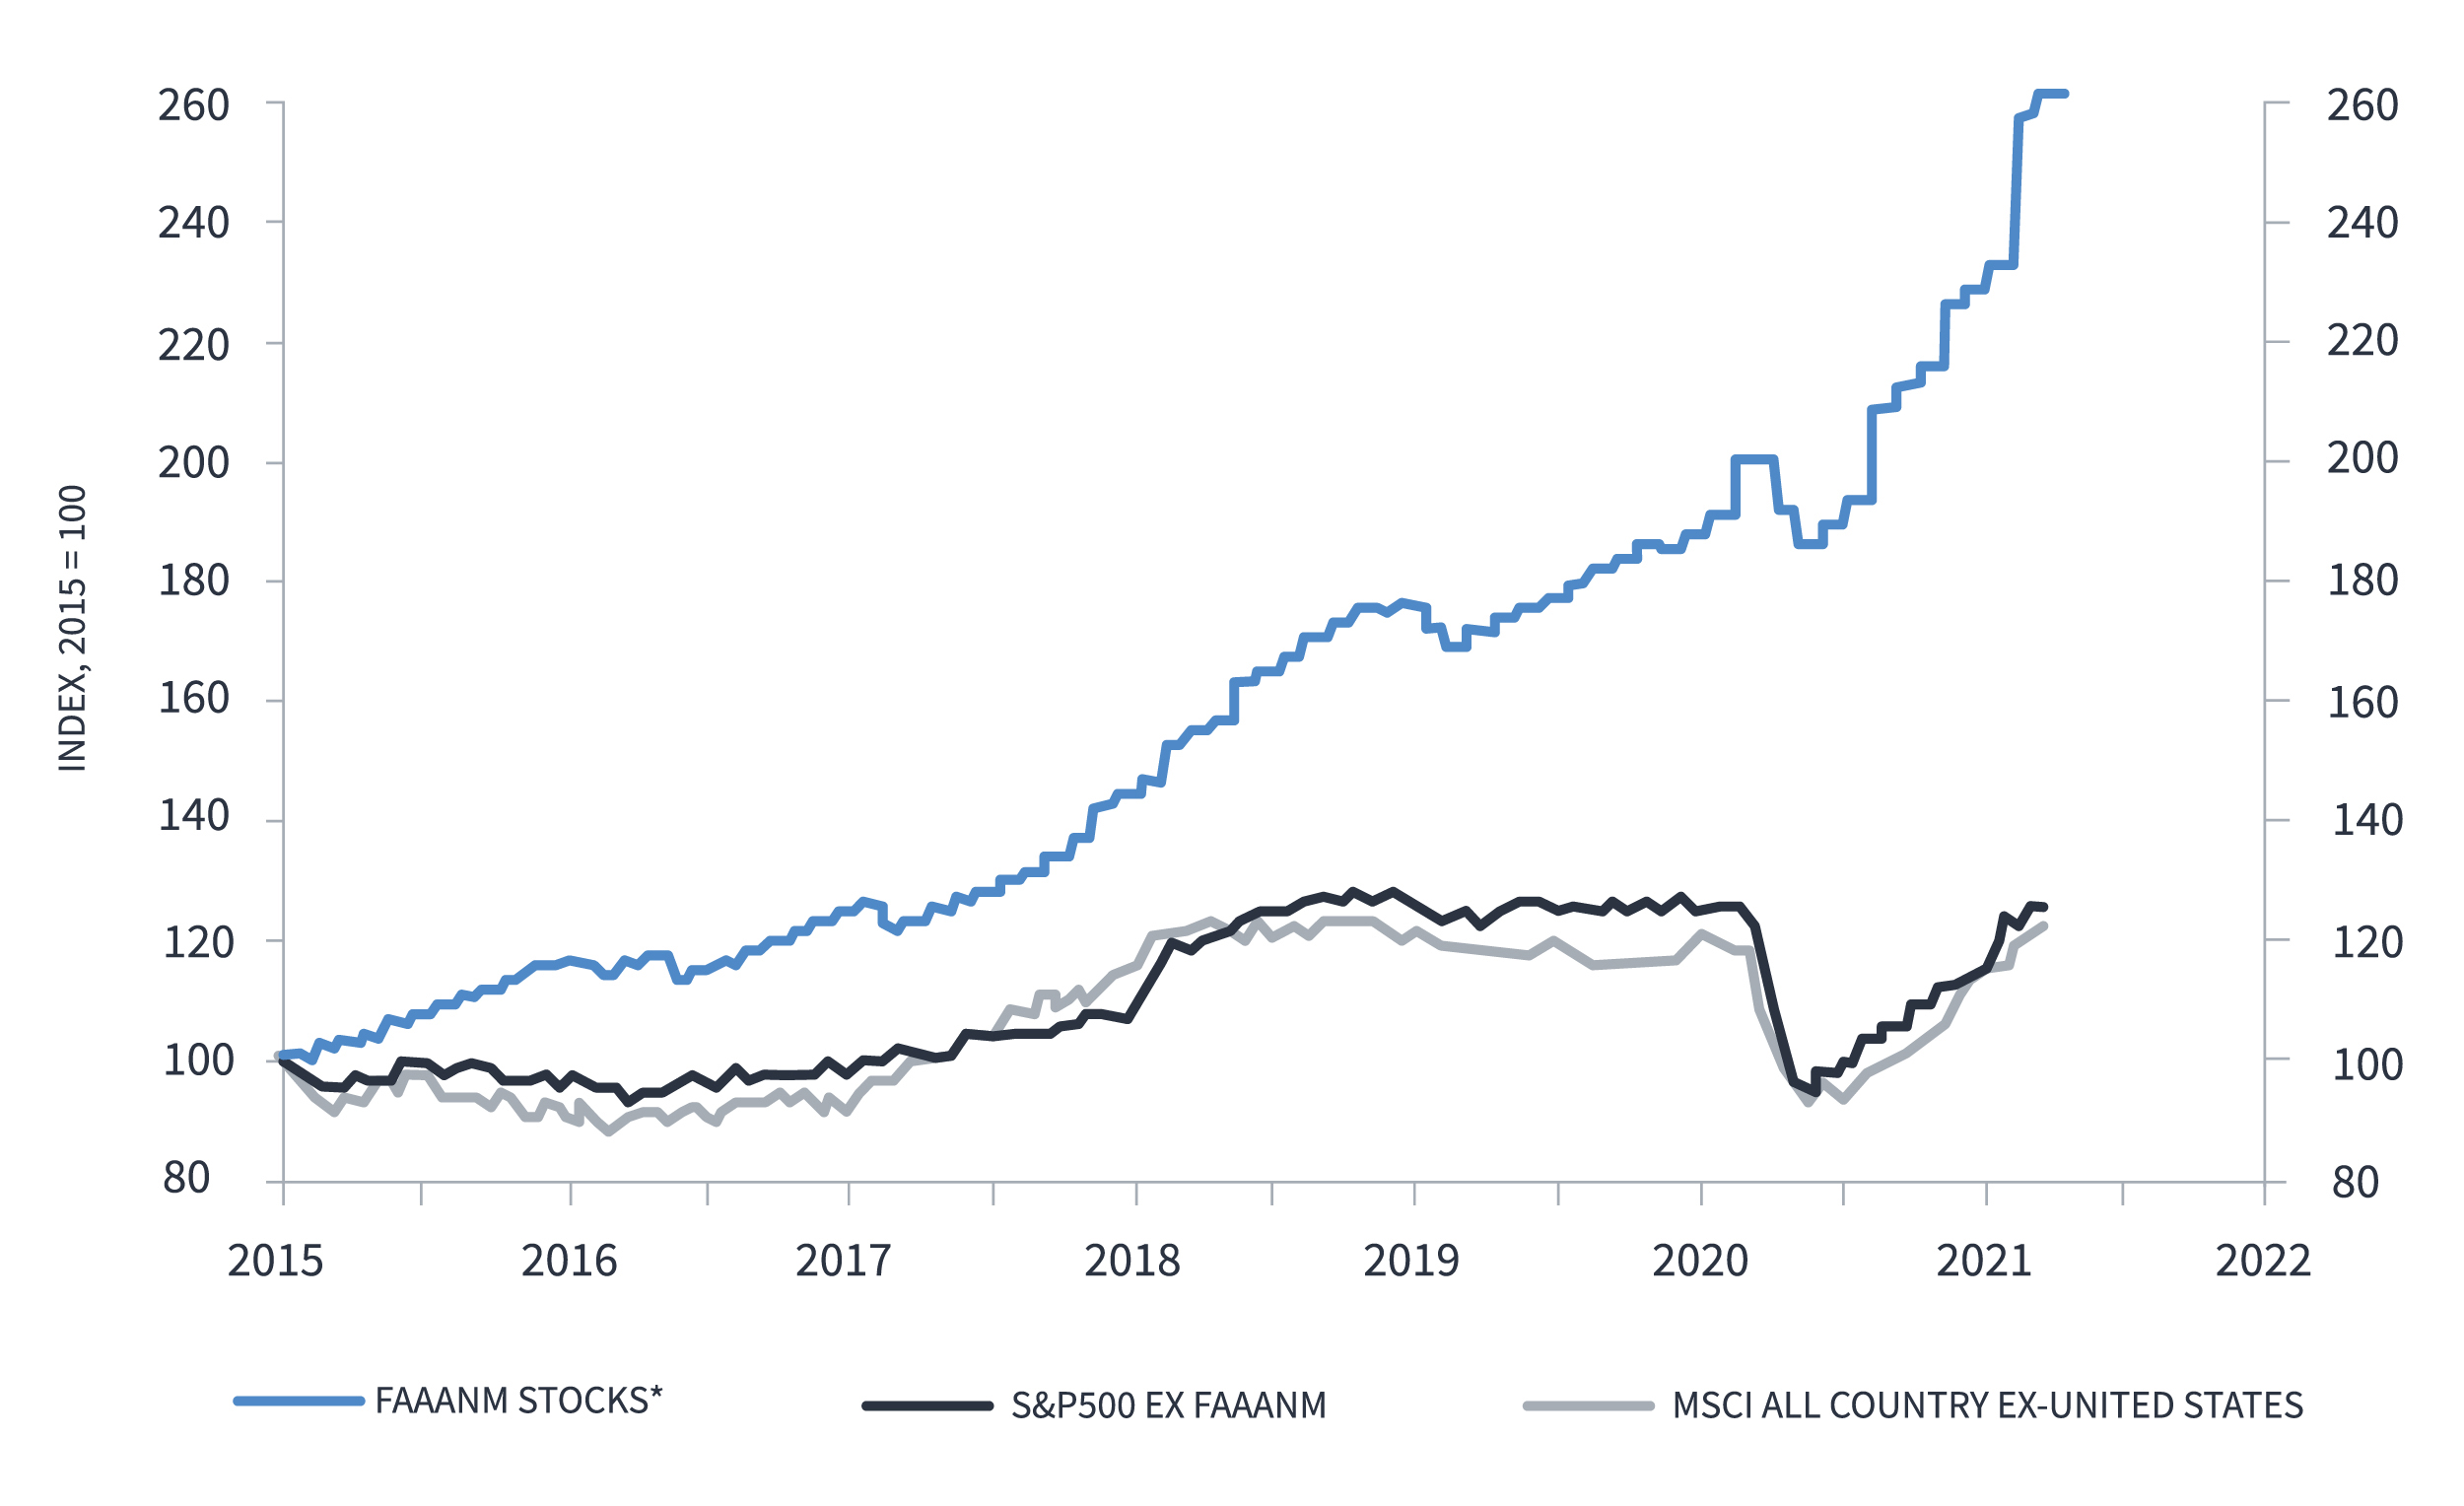
The charts below also show the dominance of a handful of companies on the S&P and MSCI ACWI ex US market value and forecast earnings. What all of these companies (Facebook, Apple, Alphabet, Amazon, Netflix & Microsoft) have in common is their digital prowess. Is this the reason for their success?
Market value, US$, 2015=100
Forecast earnings, US$, 2015=100
*Facebook, apple, aplhabet, Amazon, Netflix and Microsoft
Facebook, apple, aplhabet, Amazon, Netflix and Microsoft
Inspired by a 2017 article in the Harvard Business Review entitled “What the Companies on the Right Side of the Digital Business Divide Have in Common”, we decided to look a little closer to home to see whether we could find any similarities between digital leaders and digital laggards in our investment universe.
We asked our Global Sector Specialists (GSS) to identify the digital leaders and laggards within their sector(s) of expertise and identified 114 companies across seven sectors which formed the basis of our analysis. We used internal forecasts which allowed us to access more relevant annual earnings per share (EPS) growth on a five-year basis – data which is not available using consensus estimates.
Perhaps unsurprisingly, our analysis shows that digital leaders are growing at almost five times the rate of digital laggards. This is important because the EPS growth component is the key driver of expected returns on our five-year valuation framework.
J.P. Morgan Asset Management five-year EPS forecast
Source: J.P. Morgan Asset Management, December 2021
Why is this the case? Using history as a guide, we have taken a closer look at a leader and a laggard in the same industry, Nike and Asics. Both companies have a very long history. Asics was founded in 1949 as Onitsuka and Nike 15 years later, in 1964. Nike has grown into the far larger company, with revenue multiples higher than those of Asics.
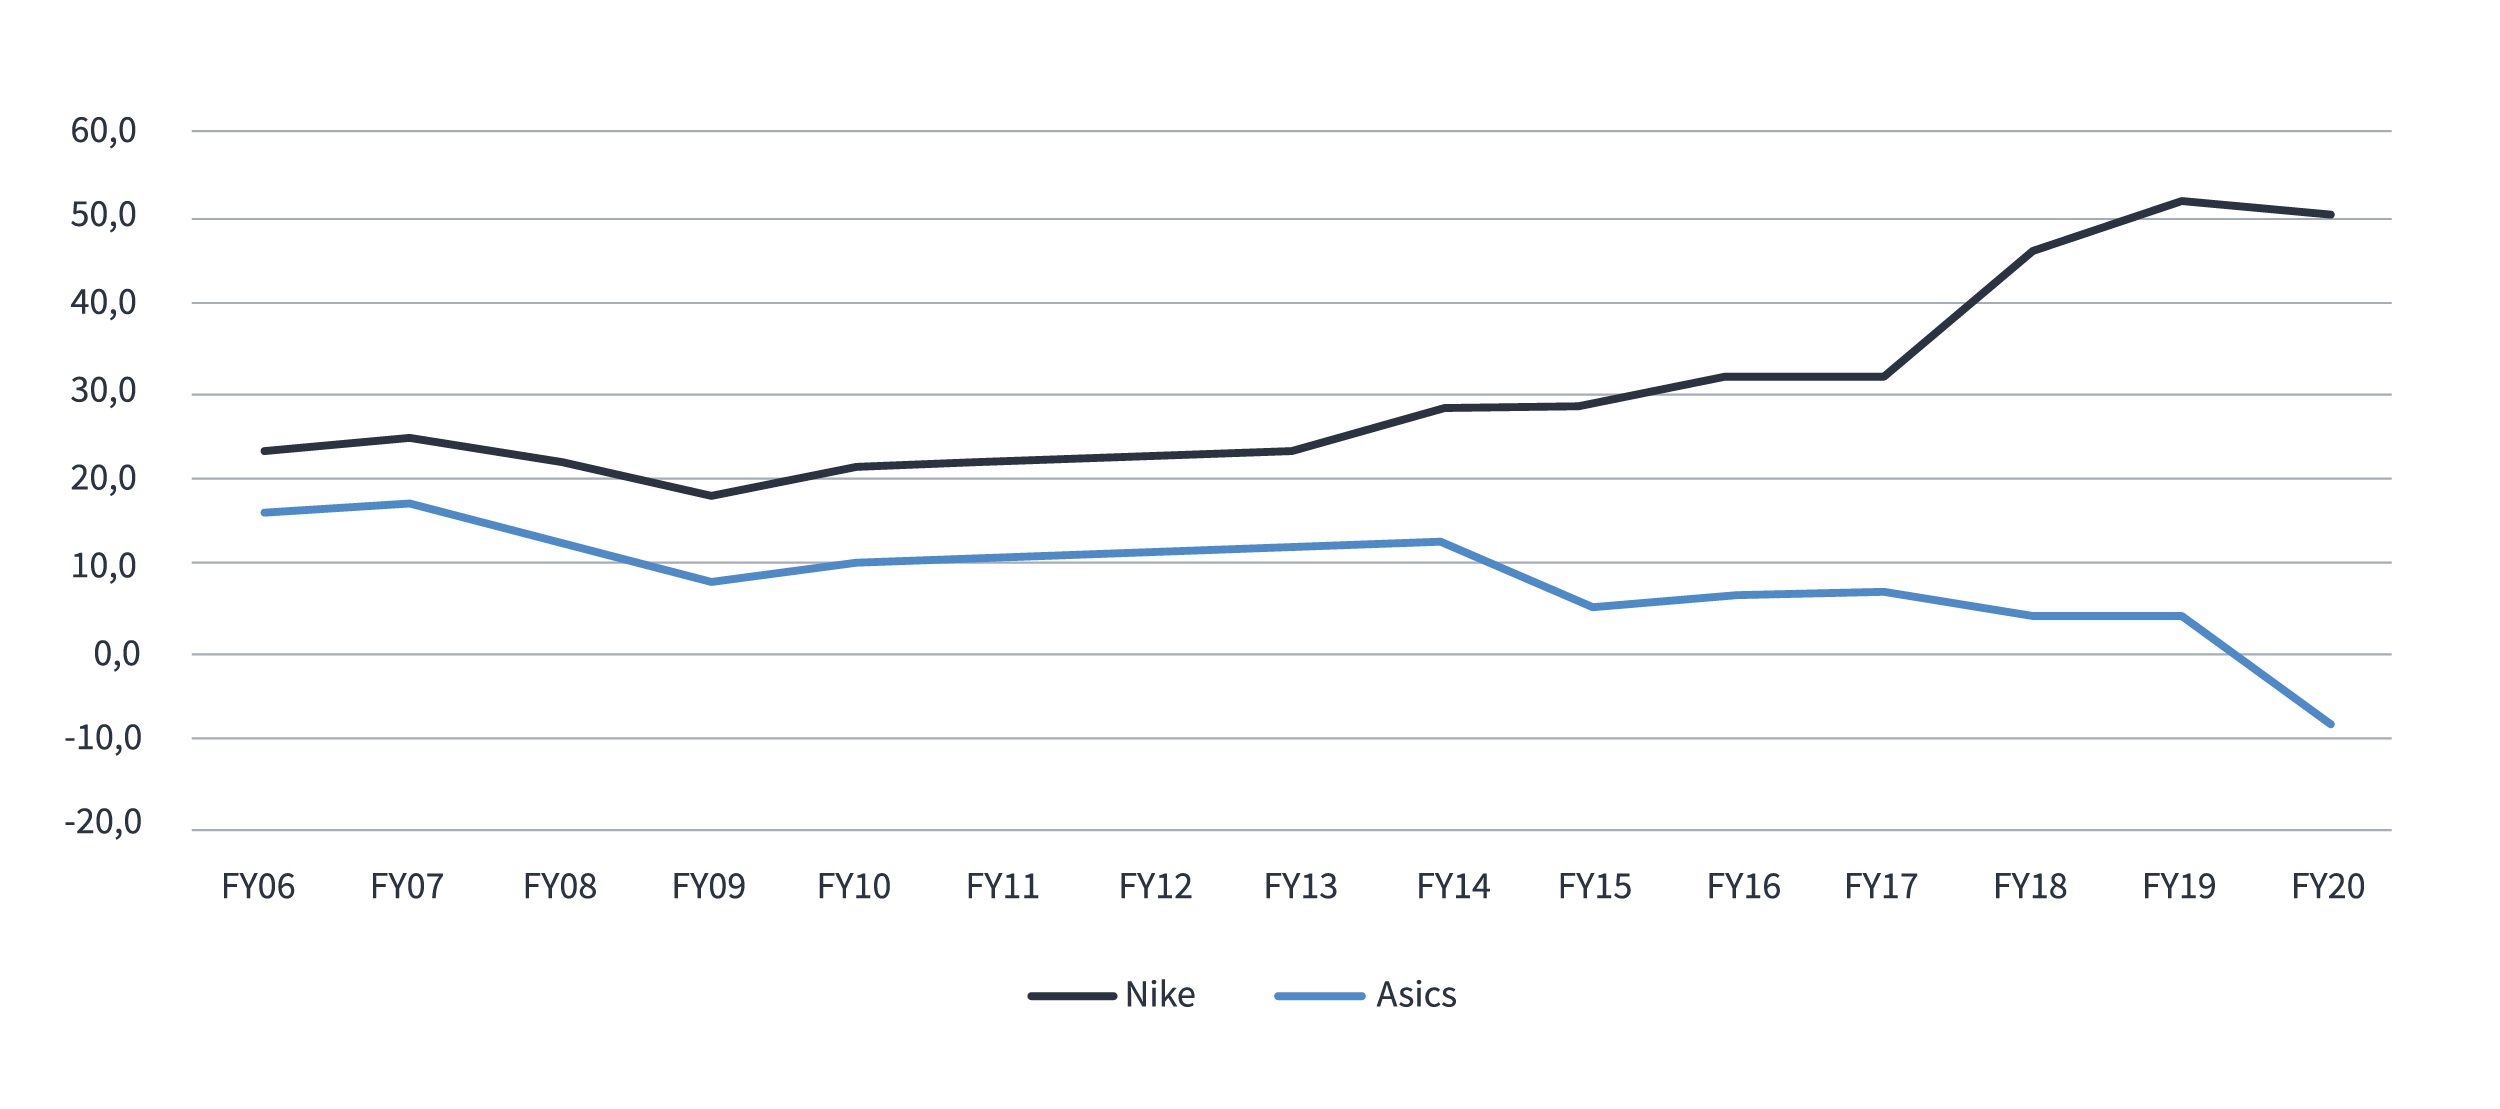
Looking at more recent history, we can see the two companies really started to diverge in their sales growth, income growth and profitability in the last few years.
Revenue growth YOY (%)
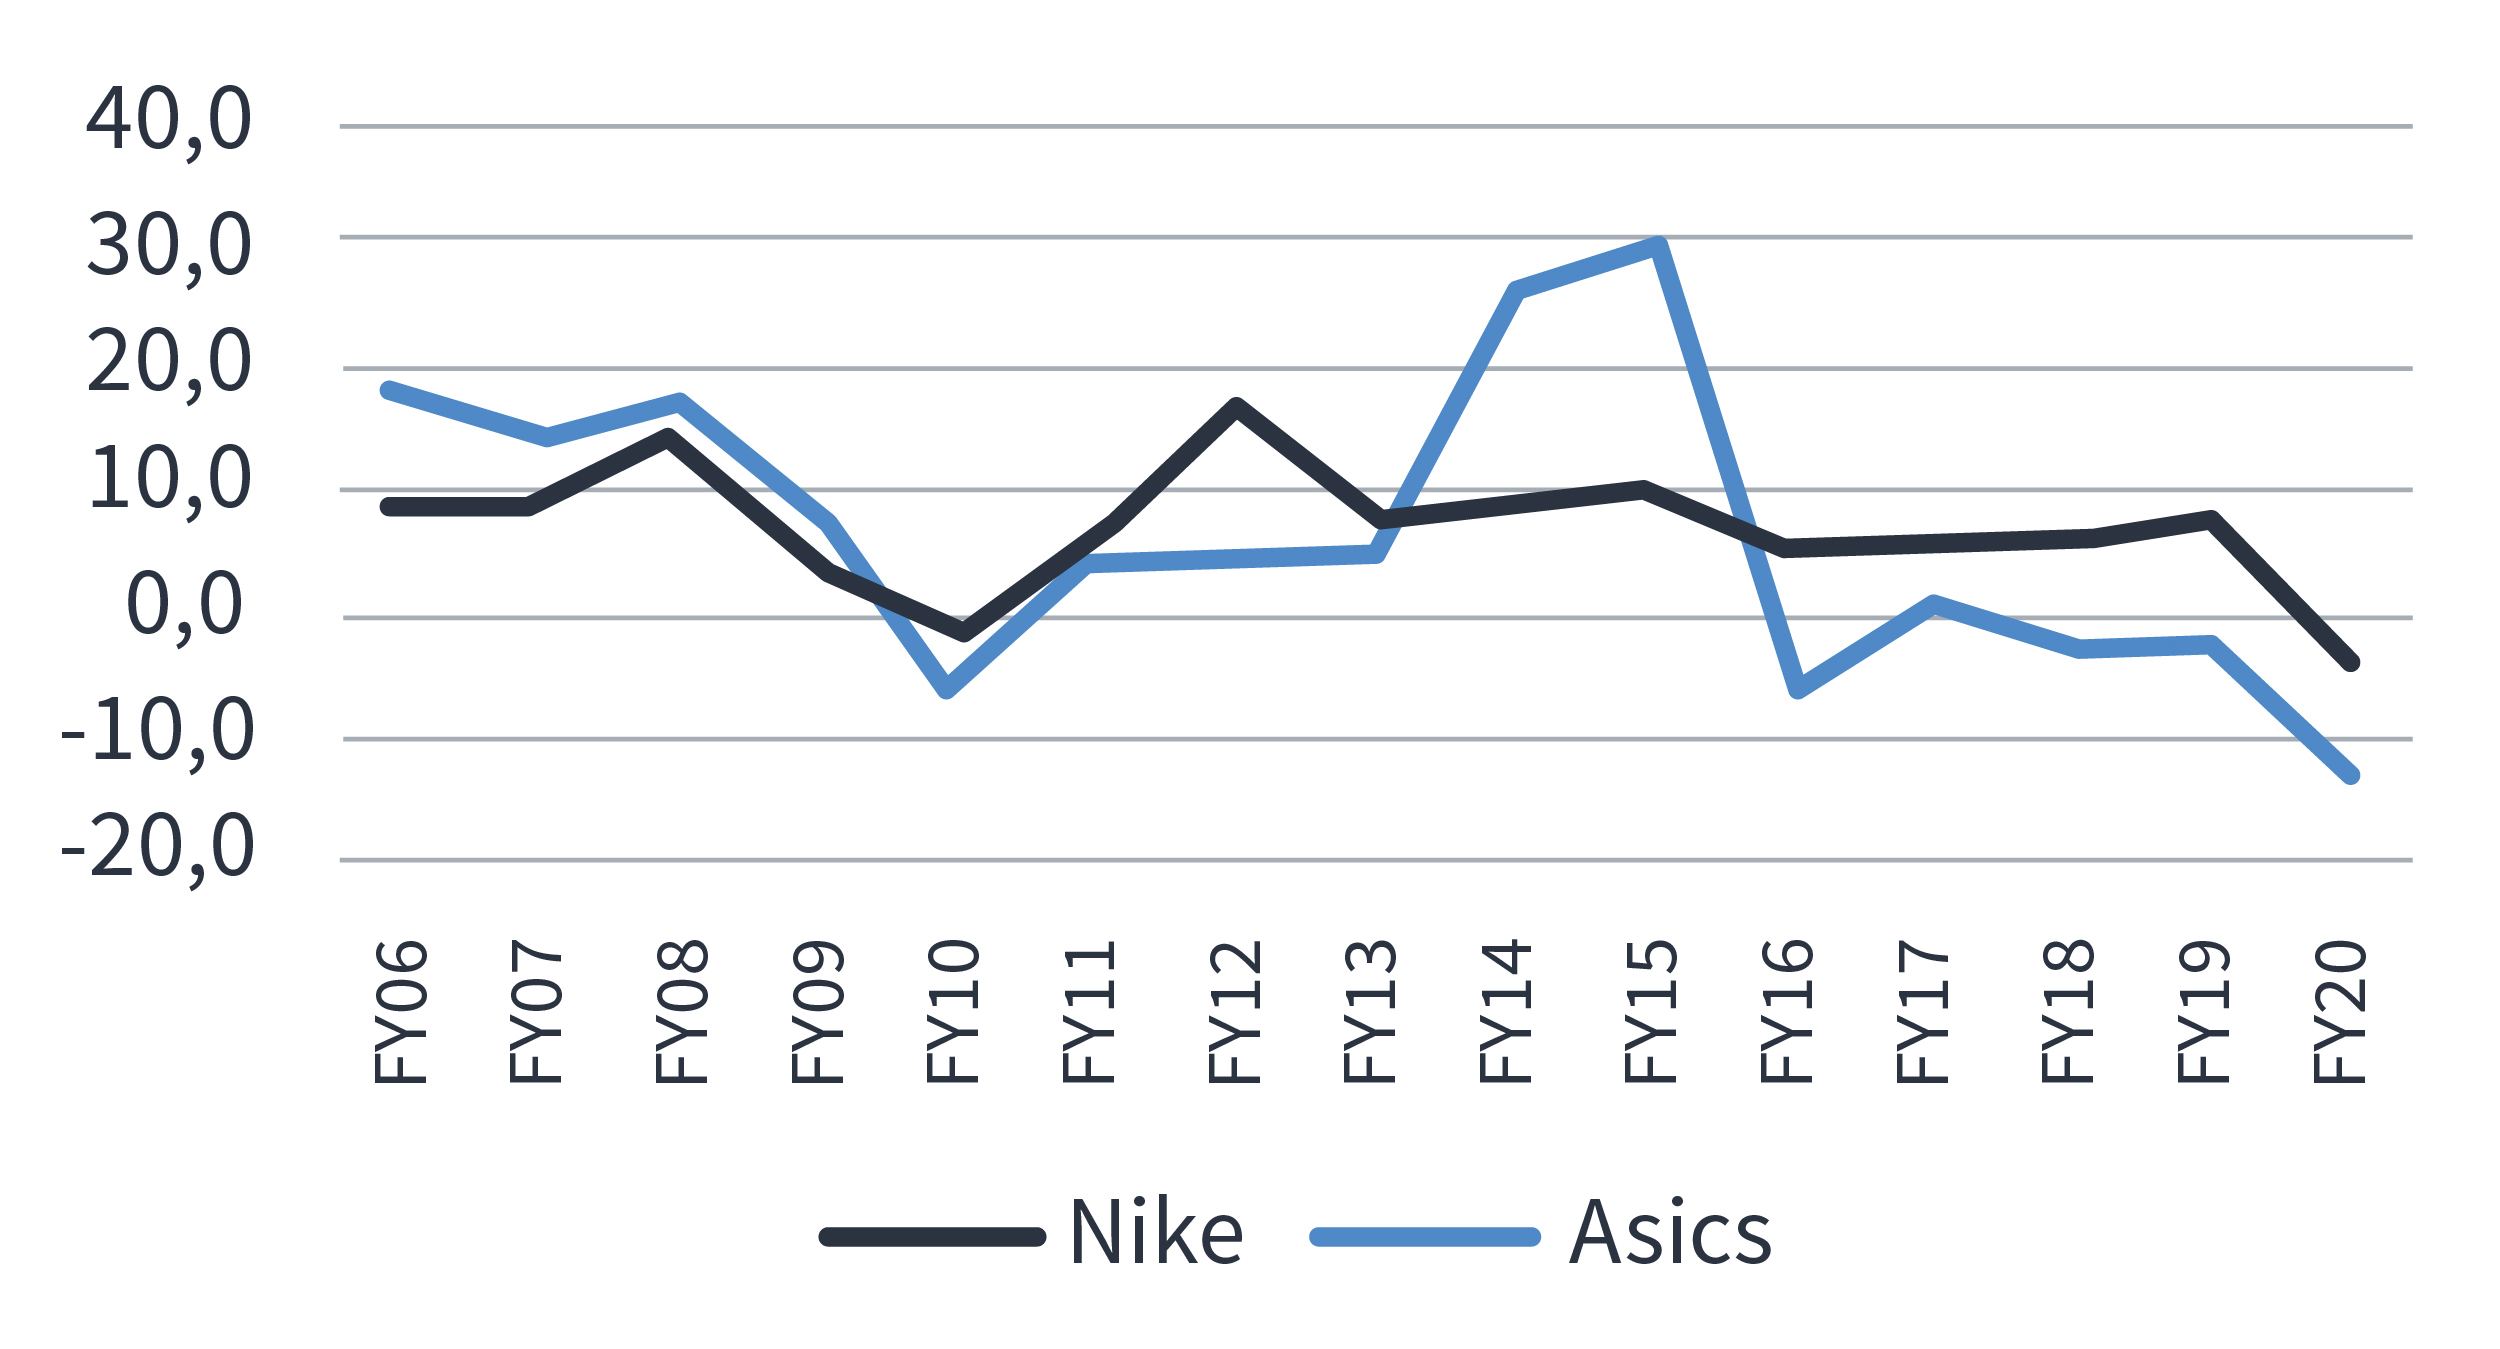
EBIT growth YOY (%)
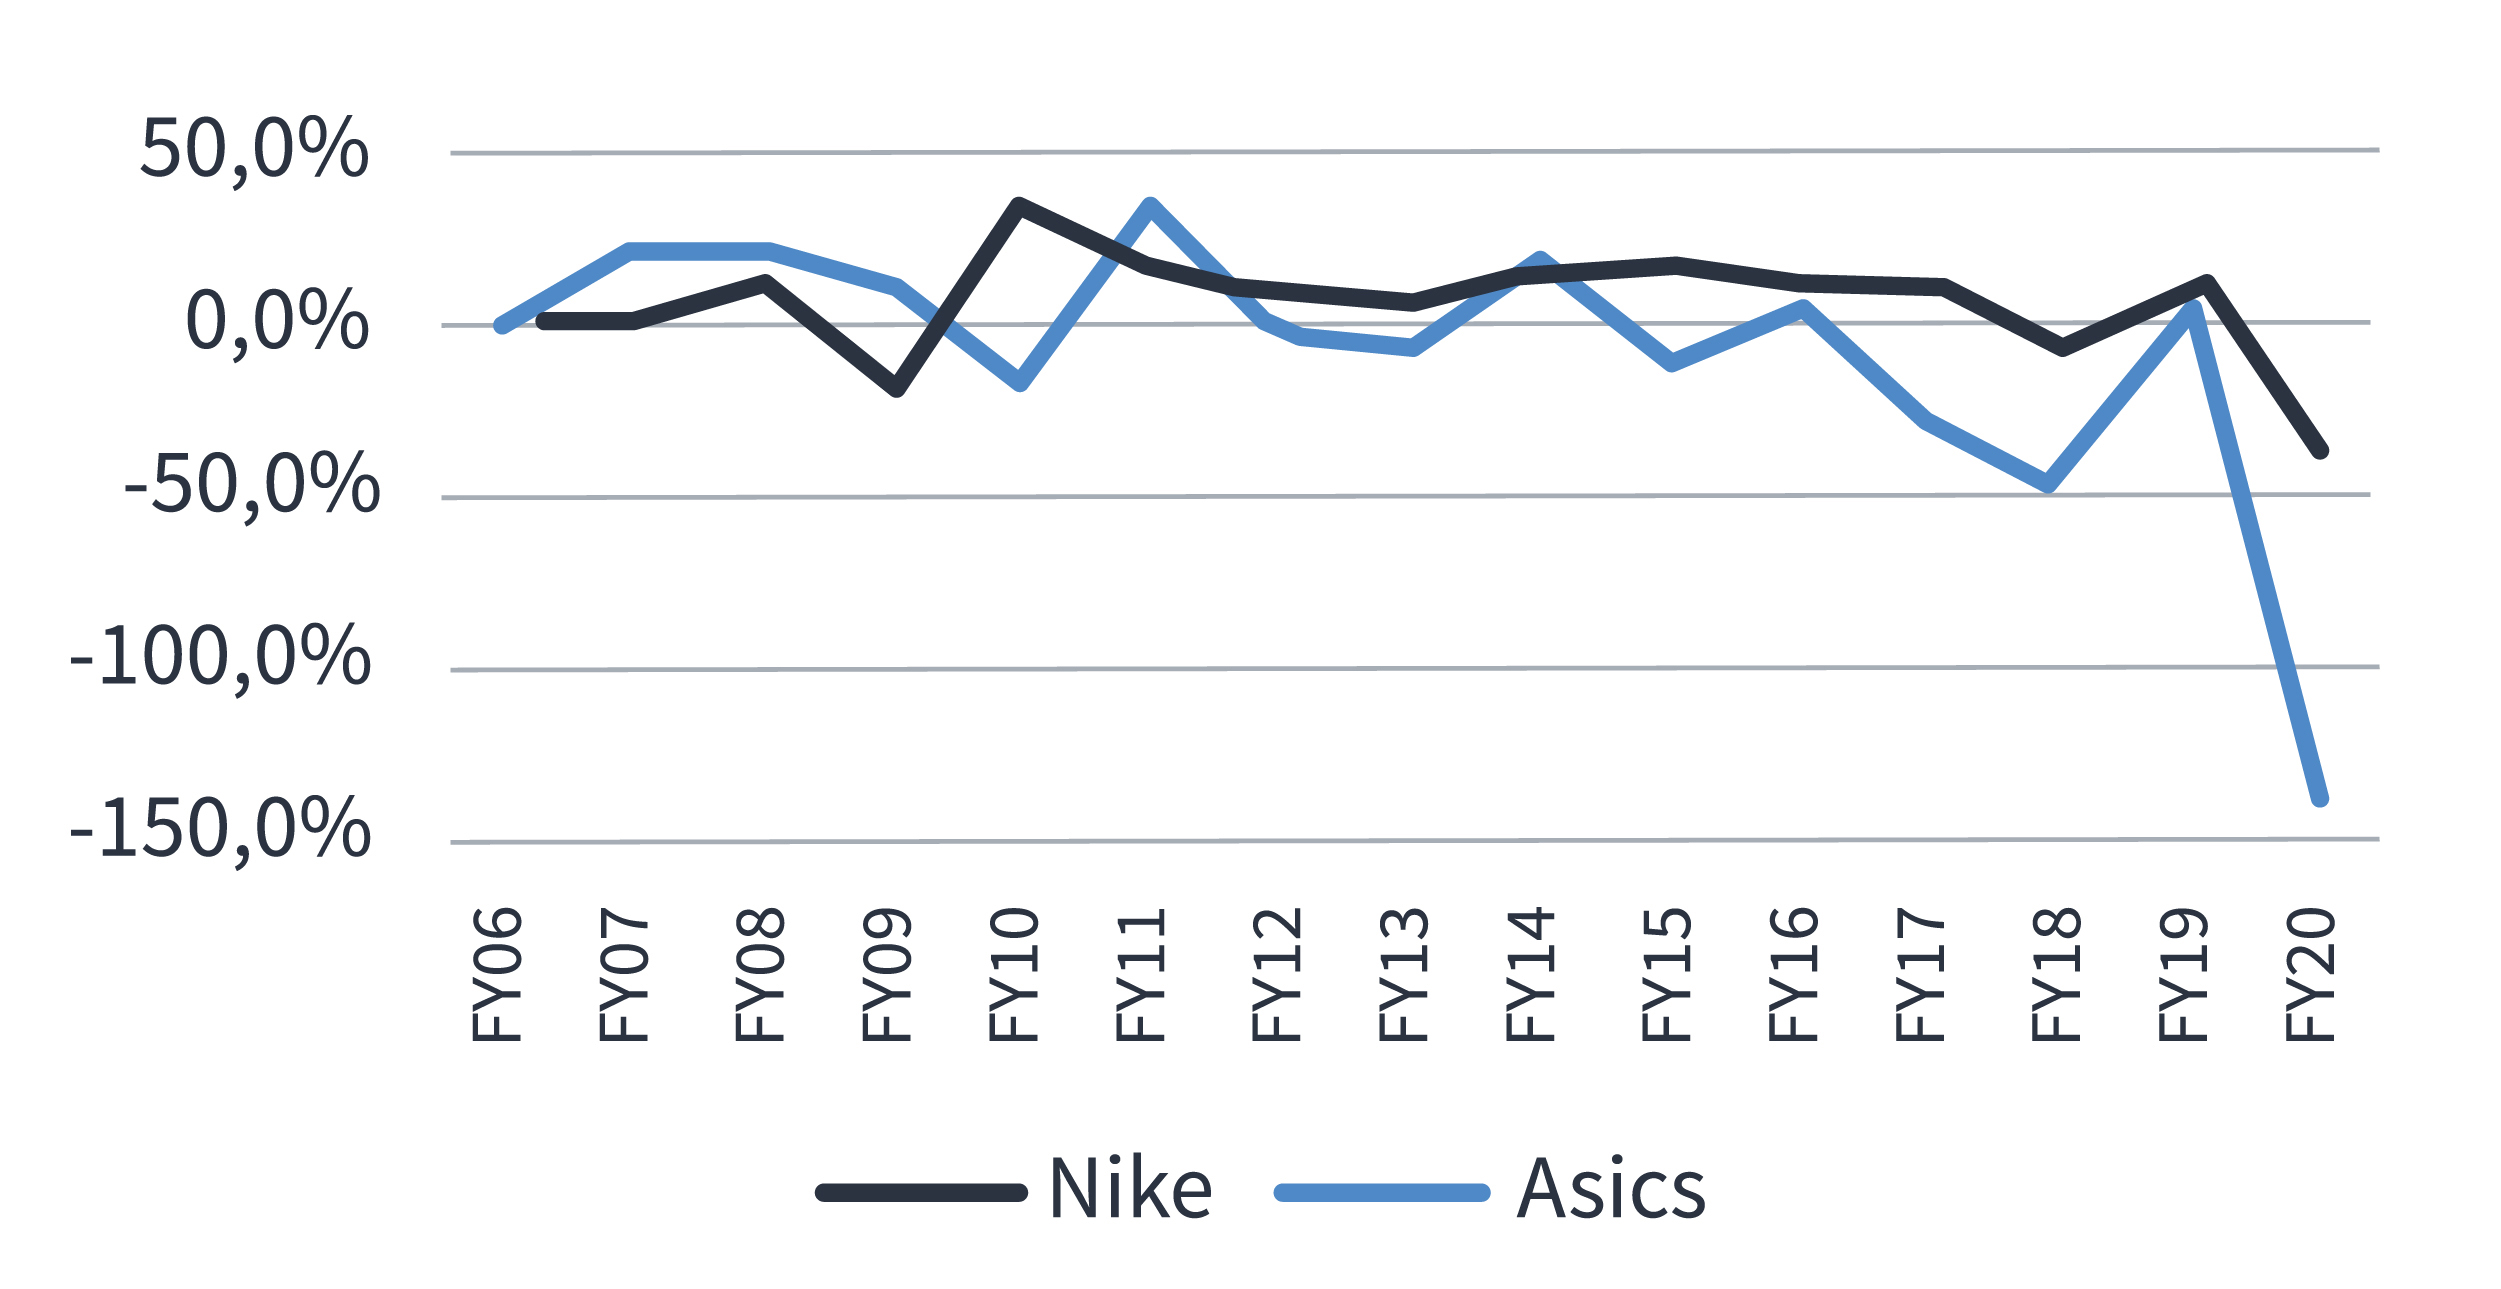
EBIT is earnings-before-interest-and-taxes
Even more interesting to us as global investors is that, while the gross profit margin of the two businesses has been remarkably similar, the profit at operating level has diverged meaningfully.
Gross profit margins (GPM) vs operating profit margins (OPM) (%)
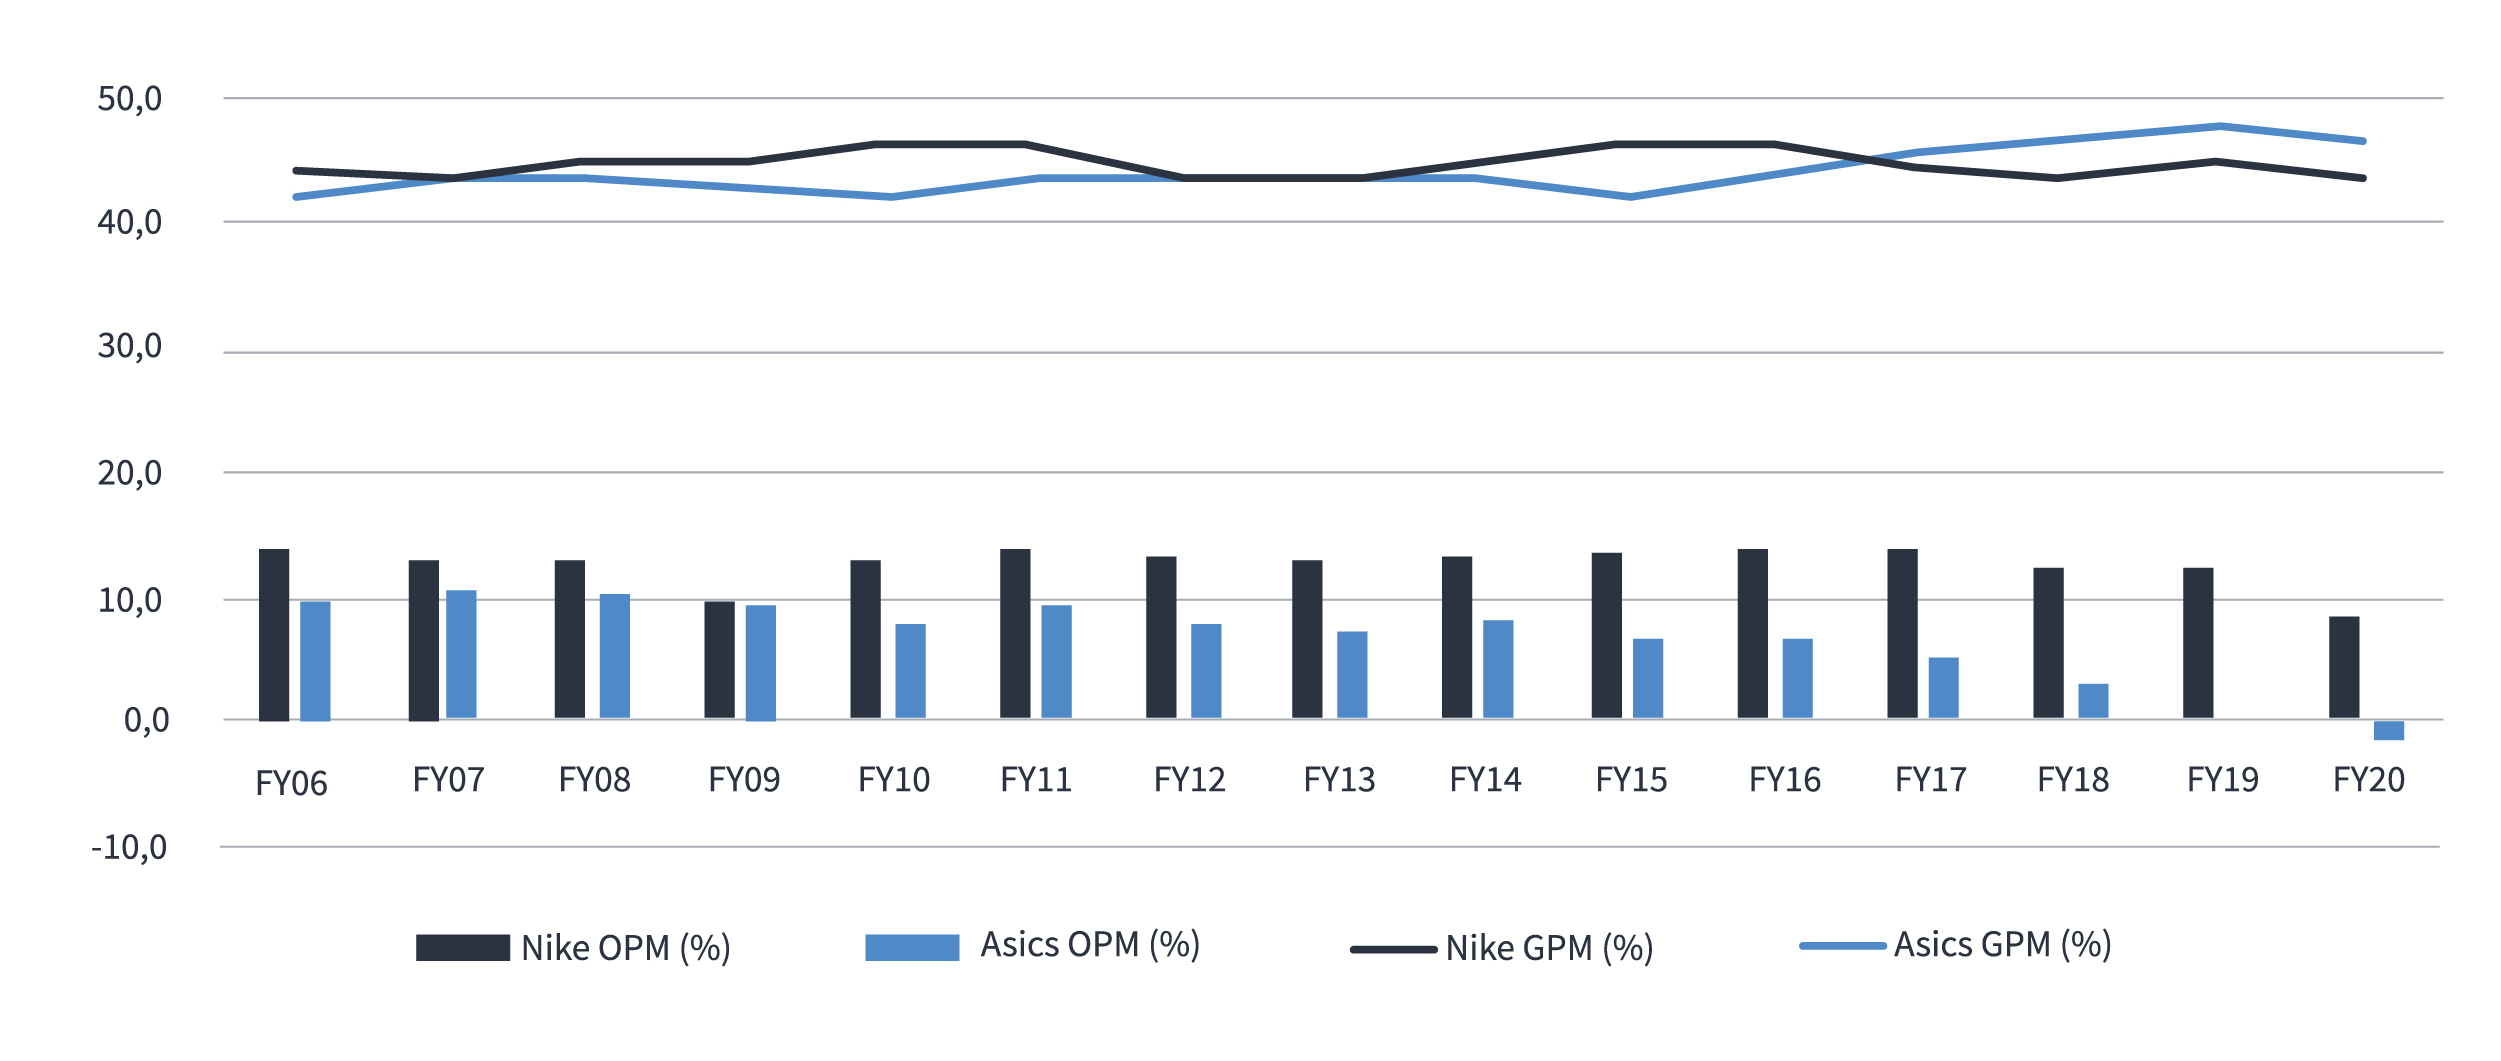
Source: J.P. Morgan Asset Management, Nike Annual Reports, Asics Annual Reports. December 2021.
We suggest one key reason for Nike’s success is its foresight in investing in digitalisation – and far earlier than its peers. Nike is explicit about this in its earnings calls, spelling out the positive flywheel of accelerating its digital transformation.
Nike’s breadth and depth gives it a huge scale advantage in employing its digital capabilities, making it viable to invest in initiatives such as the Nike training apps and the Nike run club, purely for directly better consumer engagement. This highly engaged traffic drives higher visitations to Nike’s commercial platforms, resulting in higher repeat purchases from app members and increasing average basket size. Nike also has better data on its customers, giving it the ability to better segment its customer base and create superior products. This scale, and lead, makes it hard for any competitors to replicate it to the same extent. Already, 30% of Nike’s business is digital, and its ambition is 50%.
“At NIKE, innovation is a systemic approach and it’s how we extend our lead”.
Return on equity (%)
Source: J.P. Morgan Asset Management, Nike Annual Reports, Asics Annual Reports. December 2021
While growth is important, any company which is growing without producing returns on that growth will run out of ammunition pretty fast. That is the case unless it can continually tap the market for more funds to invest in that growth, but not many companies can maintain that strategy on a sustainable basis. We analysed the return on equity for both the laggards and the leaders and found that the leaders were not only growing faster but they were also producing better returns.
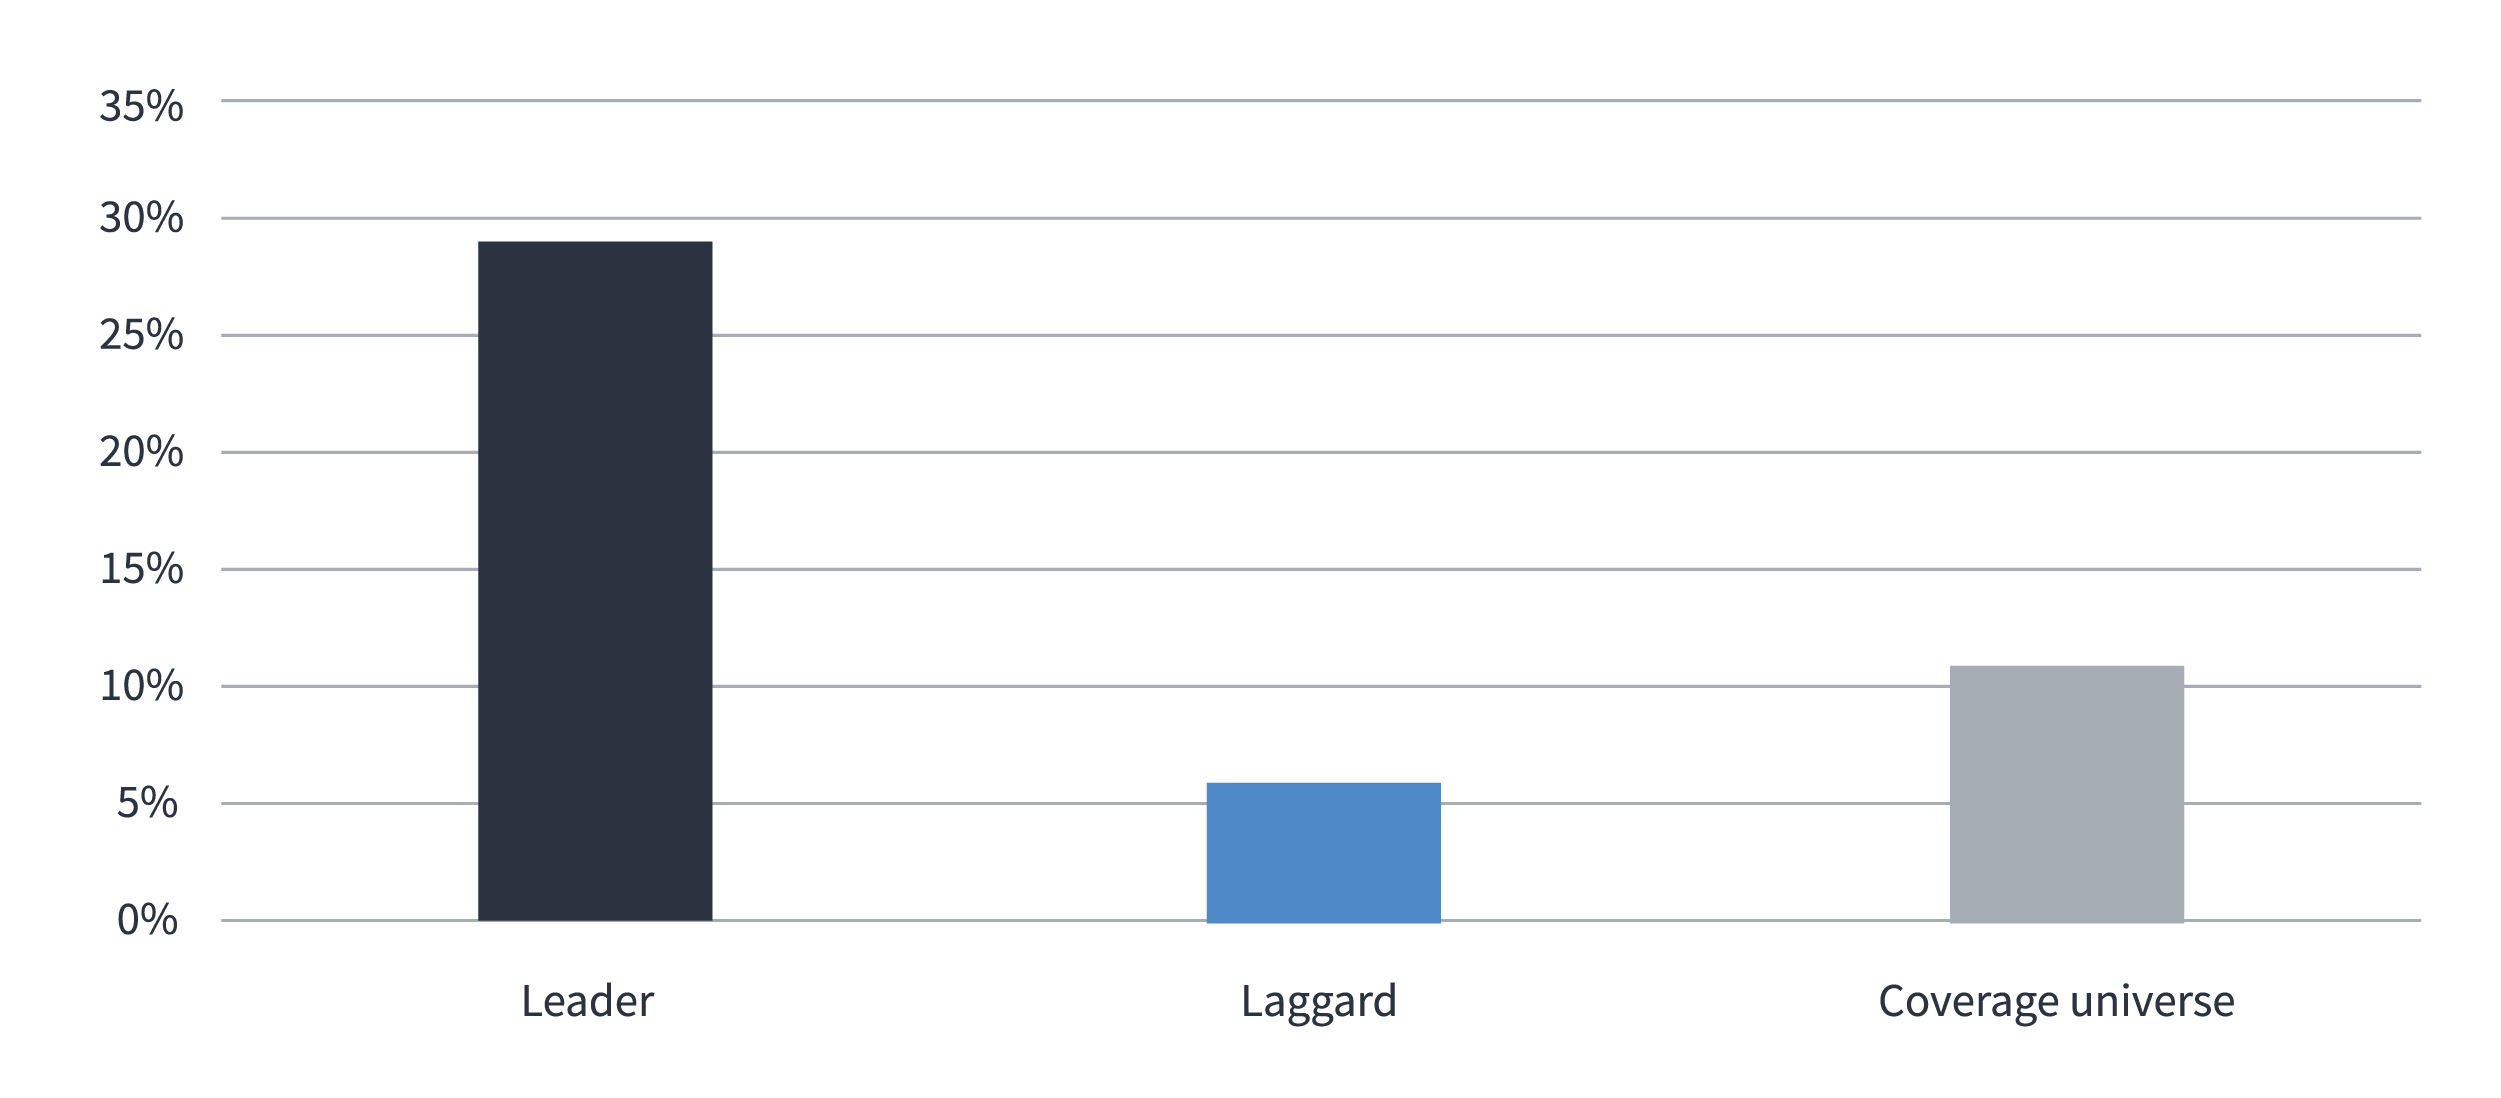
Return on equity (RoE) % across our universe

Source: J.P. Morgan Asset Management. December 2021
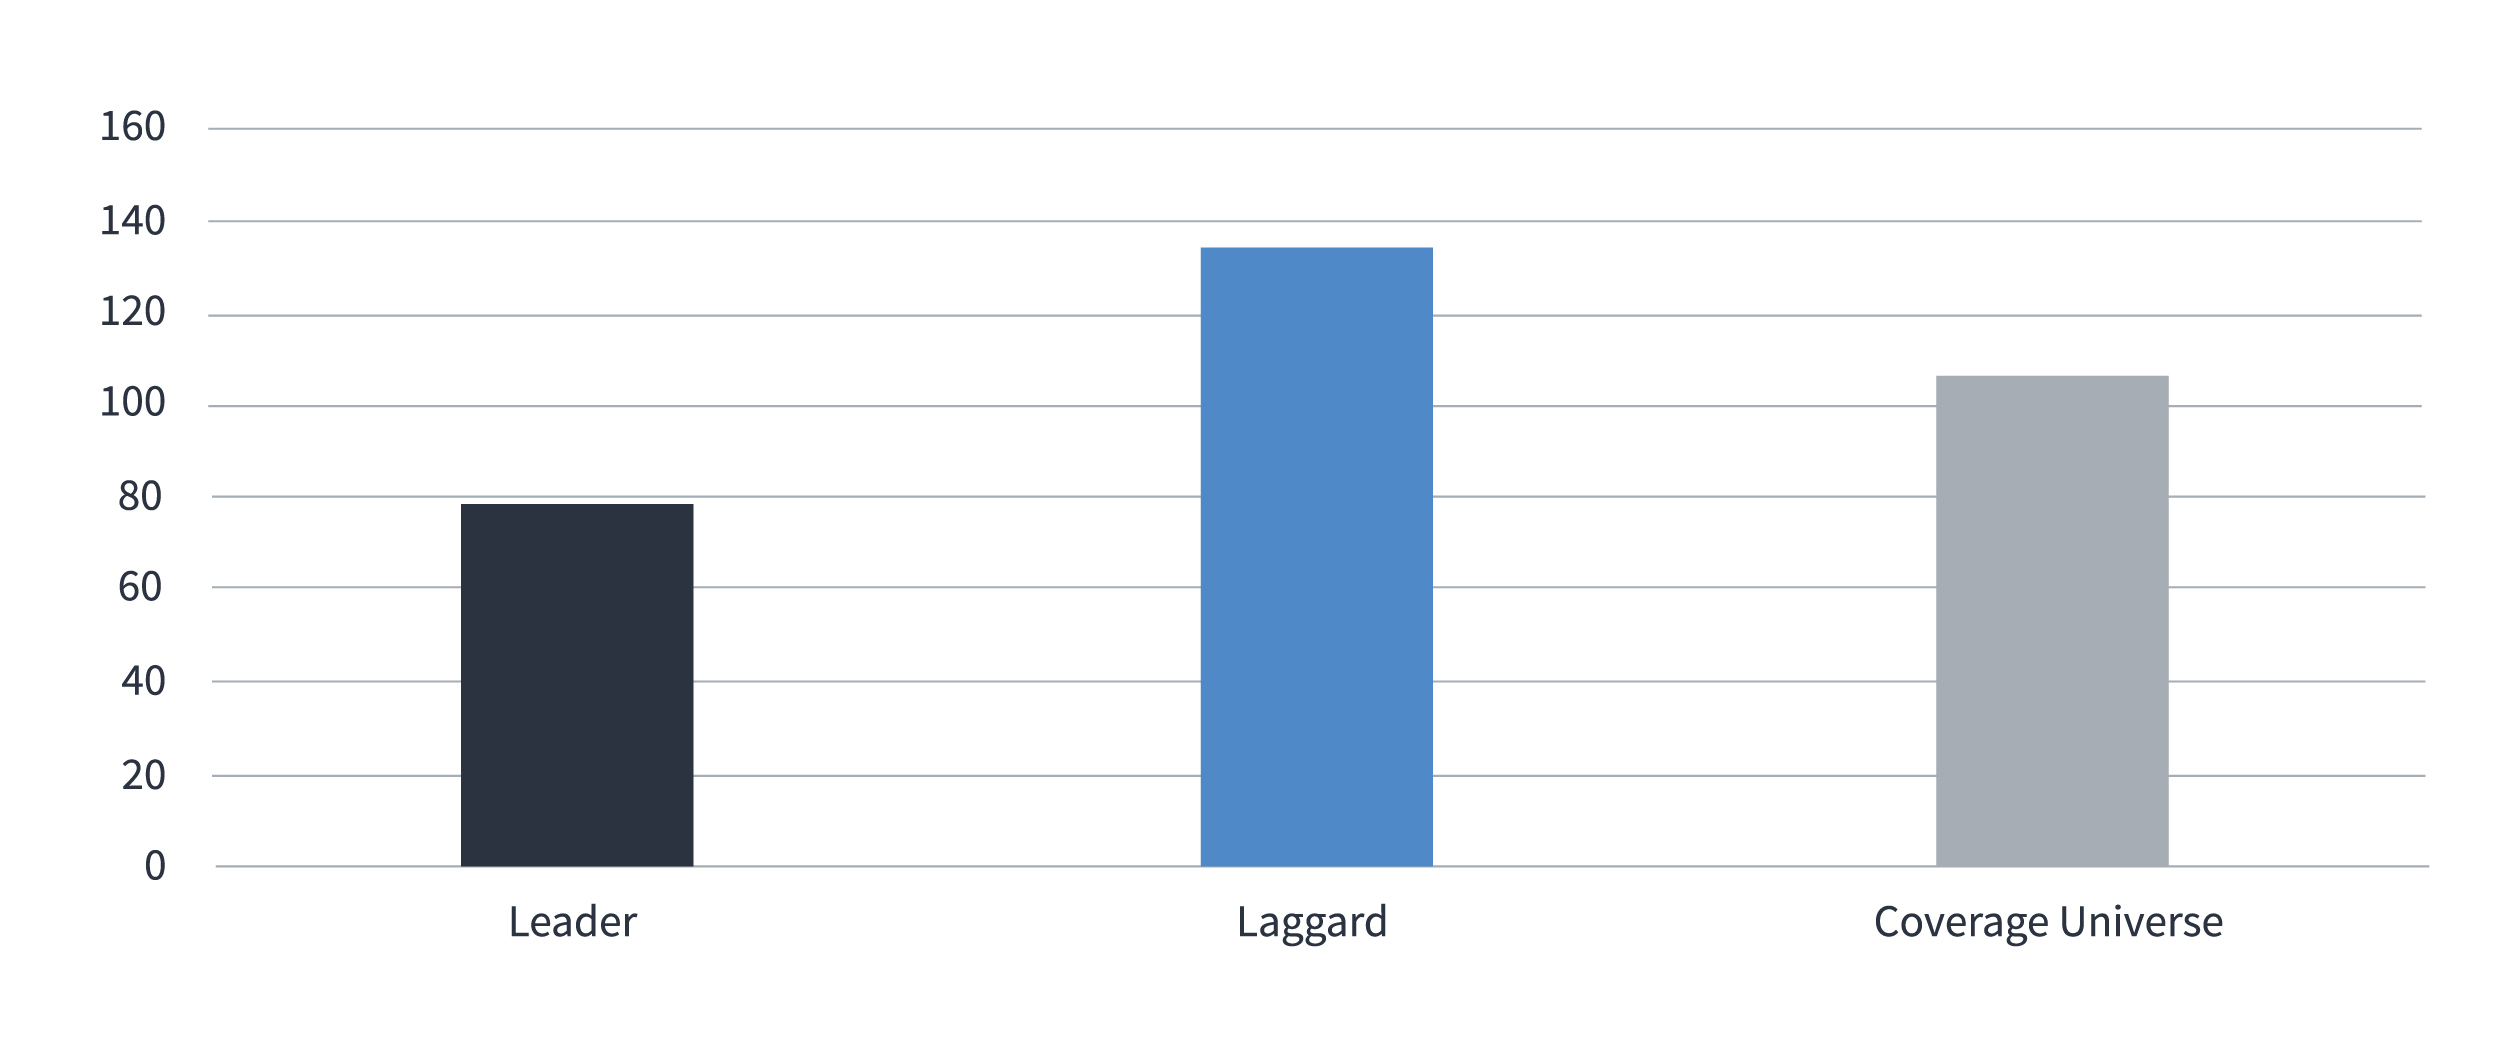
The difference was of a smaller magnitude than the growth rate, however the leaders exhibited a ROE of 19% compared with the laggards’ 15%, and 14% for the coverage universe. ROE is boosted by leverage (one of the reasons we prefer the companies we invest in not to use it) and we could theorise that the laggards’ ROE is flattered precisely because they have more debt. To test this thesis, we looked at the leverage statistics of the two groups and found that the laggards did indeed have higher leverage than the leaders.
Many investors assume that a fast-growing company is likely to be more risky and have more debt. This is, however, not what we have experienced historically, and also not what we found in this analysis. The analysis below considers total debt to equity and shows that the leaders are far less leveraged at 0.78x than the laggards at 1.38x. The reason that leverage is not a strong feature of digital leaders is the availability of funding for newer, innovative companies. While banks typically shy away, the bond market is often also closed to newer companies with less of a track record. However, at the equity level of the capital structure, both private and public markets have more appetite for these newer, innovative companies. That allows them to finance with equity, not debt, and results in their holding cash on their balance sheets.
Leverage (debt/equity) across our universe
Source: J.P. Morgan Asset Management. December 2021
We should also note that not all the stocks picked as digital leaders are new companies. Many, such as Paypal, Assa Abloy, Tencent, Otis, HDFC Bank, Allegion, Accenture, Mastercard, Nike, L’Oreal, Microsoft and Starbucks have long corporate histories and have maintained leadership positions in their industry exactly because of their digital leadership. We hold many of these companies in the Global Growth Fund, where our focus on growth and quality, along with our digitalisation theme make these, in our view, some of the best investment opportunities available to global investors today.
This article appears in the Q1 2022 edition of our StandPoint publication. Click here to download a copy of the full publication.