
Key takeouts
Conventional wisdom has it that a handful of strong days accounts for a significant portion of long-term equity returns.
However, this is only half the story.
In fact, given the choice between participating in the market’s best days and avoiding its worst days, one should actually prefer the latter. In reality the best and worst days often occur in quick succession, so it is unrealistic to think that one can capture one while avoiding the other.
‘Market timing’ is market parlance for trying to spot good and bad periods and trading accordingly. This is regarded by many as a fool’s errand but we think it is possible. In this piece we demonstrate the value of avoiding weak market phases, rather than avoiding individually weak days.
Overview
“It ain’t what you don’t know that gets you into trouble.
It’s what you know for sure that just ain’t so.” – Mark Twain
In this paper we unpack two commonly-held assumptions: that one must be in the market on its best days to have a chance of long-term outperformance, and that market timing is impossible.
We believe that these assumptions do not survive scrutiny, and that a proper understanding of the data can lead one to a simple and effective long-term strategy. One can’t help but wonder how many more fallacious assumptions are holding us back (and the alpha on offer to anyone willing to question them).
Myth-busting
Capturing the market’s best days and market timing
Over the long term, financial markets are rational discounting machines which do a fair job of valuing cashflows. In the short term, however, they are driven by the ebbs and flows of two human emotions – greed and fear – as market participants react to new information. Markets’ complexity is amplified by the circular reality (and one of our key investment tenets) that markets influence economies as much as, if not more than, economies influence markets.
Human beings may be the world’s most successful species but, as it turns out, we are flawed observers of data and poor judges of probability. There is an entire branch of science devoted to our cognitive frailties, and financial markets are its favourite laboratory. Financial service providers selling to ordinary citizens are on fertile ground for inciting both fear and greed. The temptation is to construct compelling marketing messages based on half-truths which their audience cannot possibly interrogate.
Here we debunk two myths that are commonly peddled in sales pitches.
- Myth 1: A significant portion of long-term equity returns comes from market rallies on a handful of strong days. No-one knows when these days might happen, so rationally the investor can only hope to capture them by simply staying invested.
- Myth 2: It is impossible to pick the turning points in the market (tops and bottoms) so investors must stay invested in equities to accrete the returns from what is generally regarded to be the best-performing asset class over the long term.
Myth 1: Participating in the equity market’s strongest days is key to capturing equity’s superior long-term returns
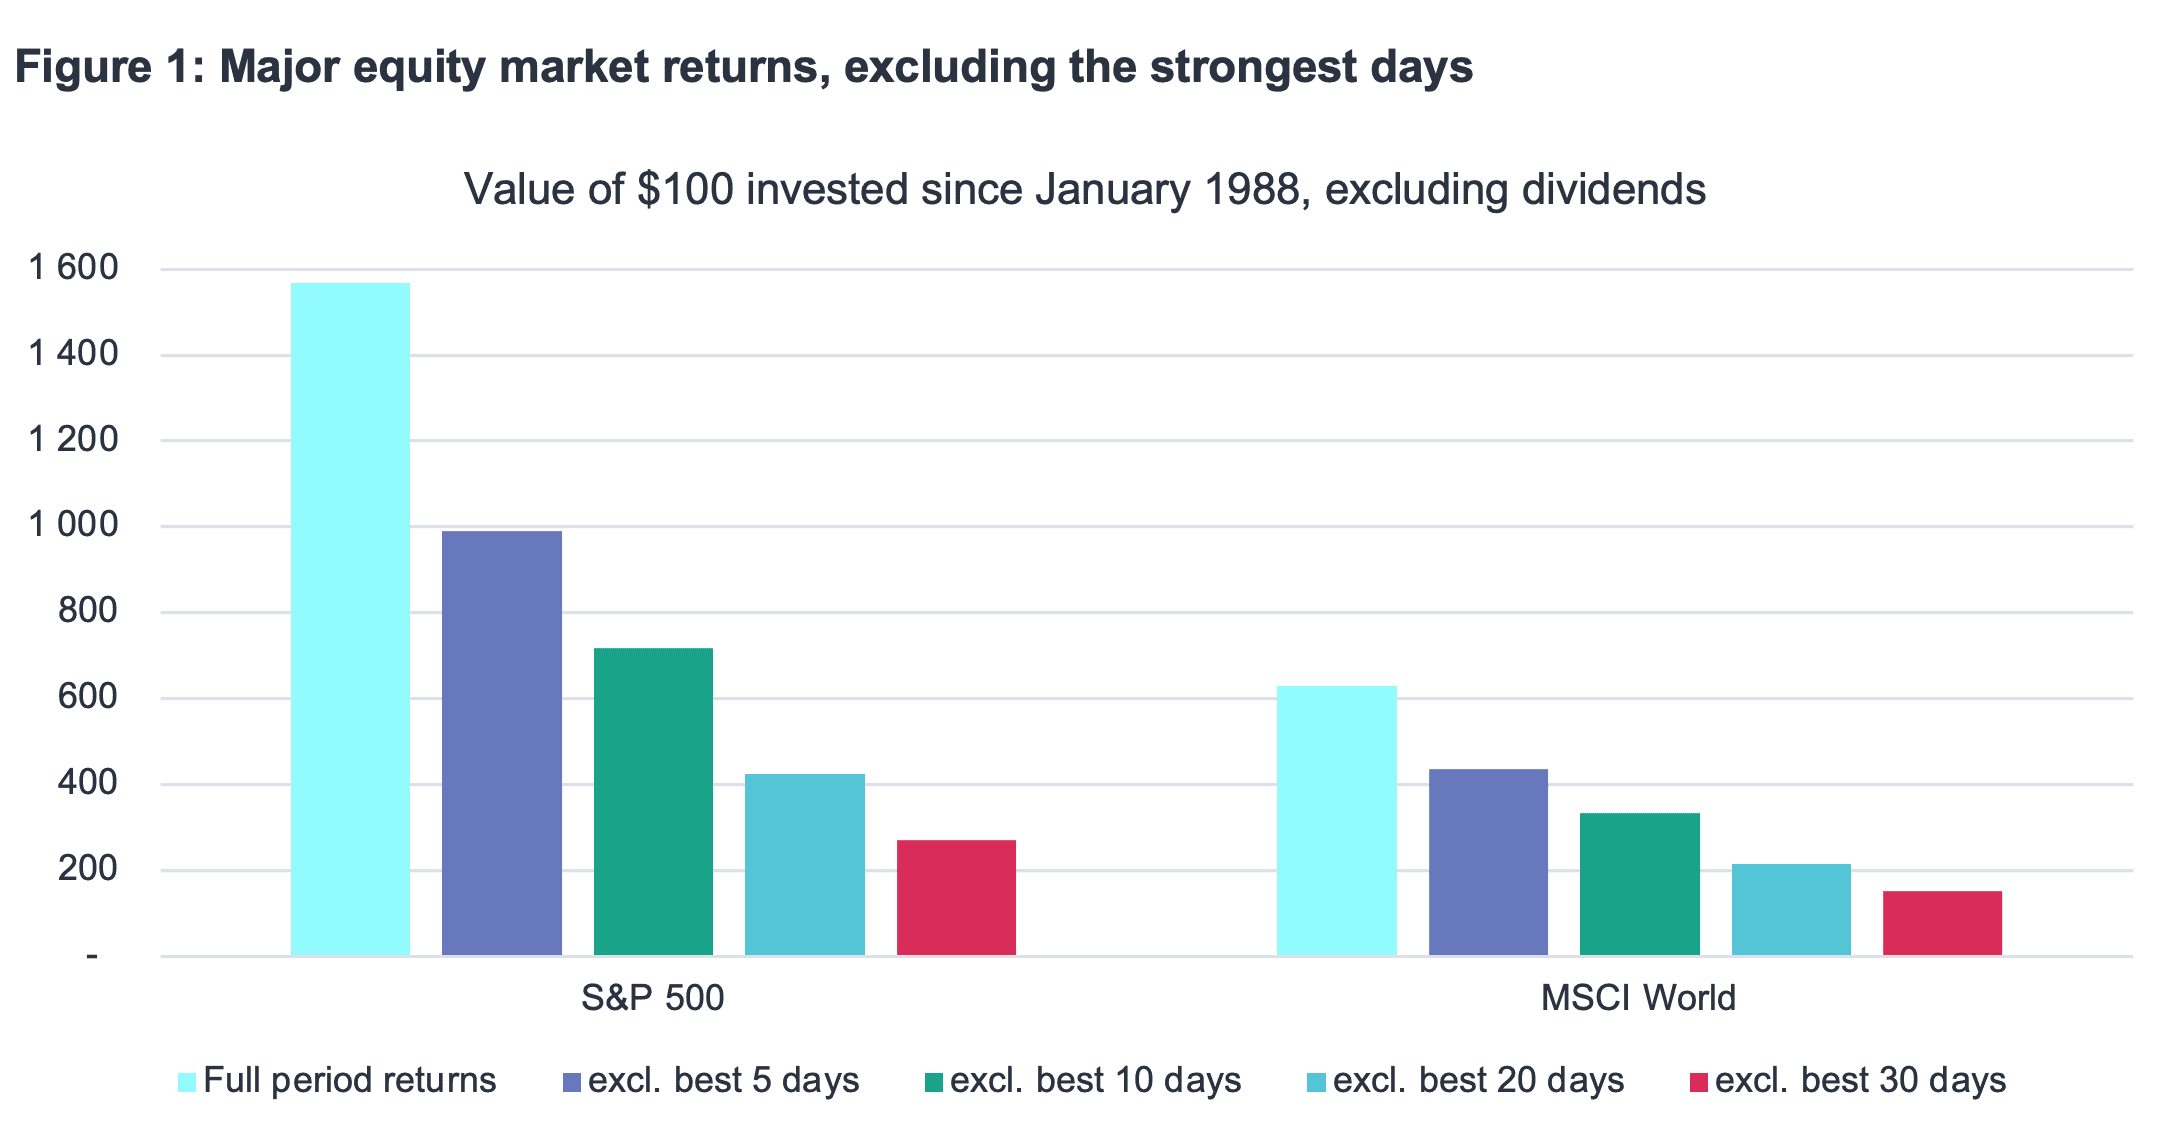
The cost of missing out on the market’s strongest days is often used as justification for staying invested in equities. At face value, this sounds logical. Indeed, using data from Bloomberg, Figure 1 shows that for both the S&P500 and MSCI World Developed Markets indices, excluding the top 10 days from the 9 000 trading days since 1988 would have roughly halved the total period returns.
(Note: MSCI World daily history began in January 1988).
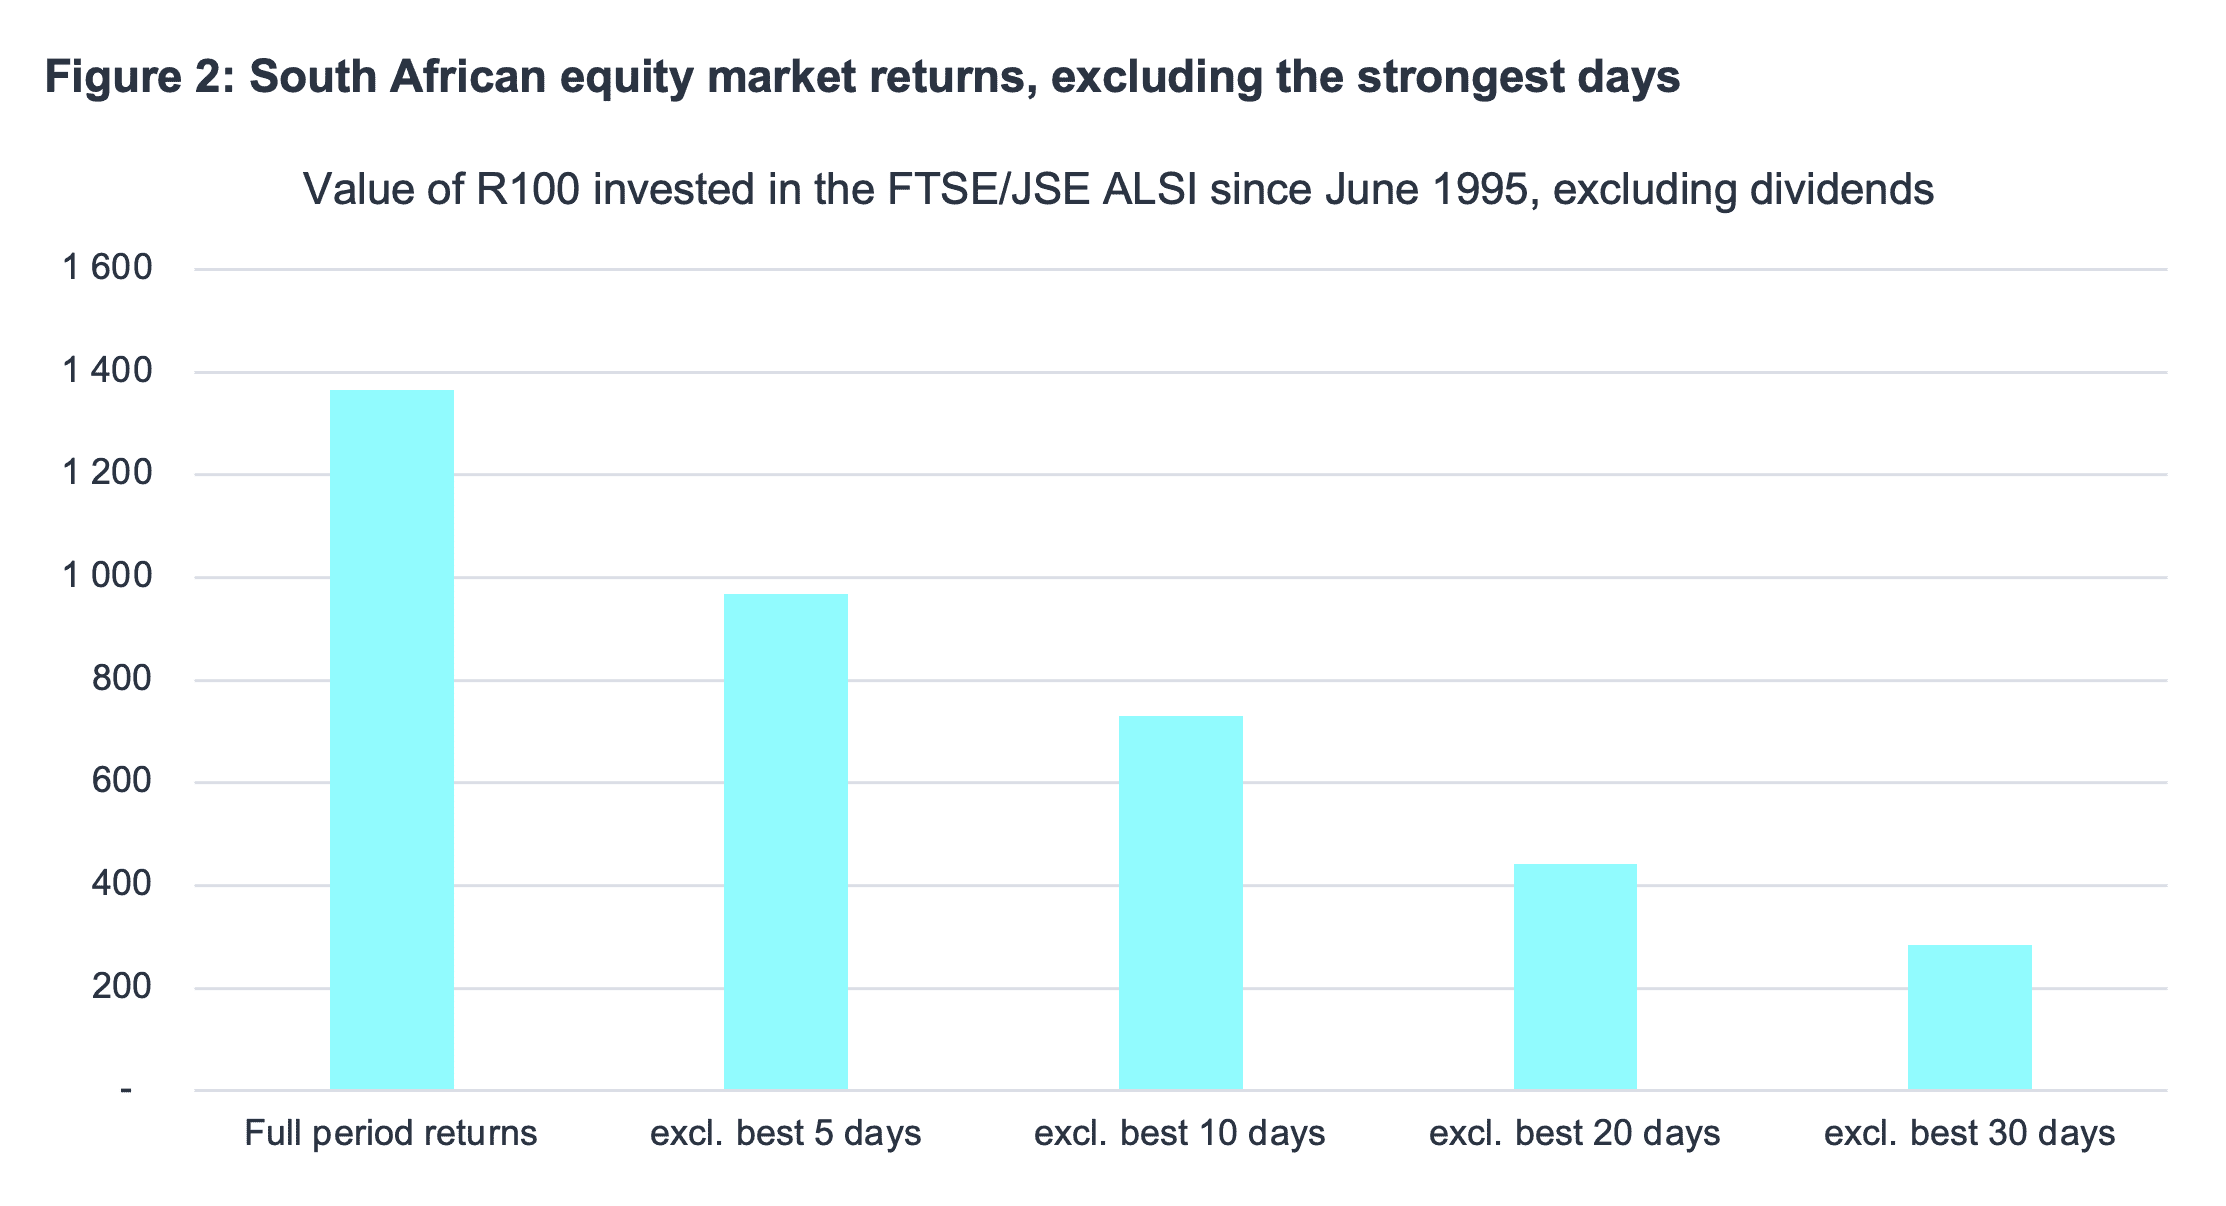
In Figure 2, we observe a strikingly similar phenomenon for the FTSE/JSE All Share Index. In this case, using the maximum daily history available from Bloomberg, excluding the top 10 days from the 7 000 trading days since 1995 would have roughly halved the full period return.
So far, so good but this is not the whole picture. What if we re-frame the problem and ask how much better off the investor would be by avoiding the worst days on the market? The data reveal that avoiding the market’s worst days dwarfs the value gained from participating in its best days!
Simply put, the worst days hurt more than the good days help. Why is this?
Two reasons:
- Fear and greed are the two emotional ‘poles’ in the market, but for good evolutionary reasons fear is the more powerful of the two. Also, the reality is that not everyone is greedy at the same time but when bad news hits the headlines everyone tends to run for cover. It is no surprise therefore that markets tend to fall more on their worst days than they rally on their best days. As the adage has it, ‘markets go up on the escalator but down in the lift’.
- Returns compound asymmetrically. Even if, in absolute terms, the worst and best days were of equal magnitude at, say, 10%, investors would still be better off avoiding the worst days. After all, a 10% loss requires an 11.1% return to break even. This effect worsens as losses mount: a 25% fall requires a recovery of 33.3%.
Figure 3 shows just how powerful – and asymmetric – is the avoidance of large negative returns.
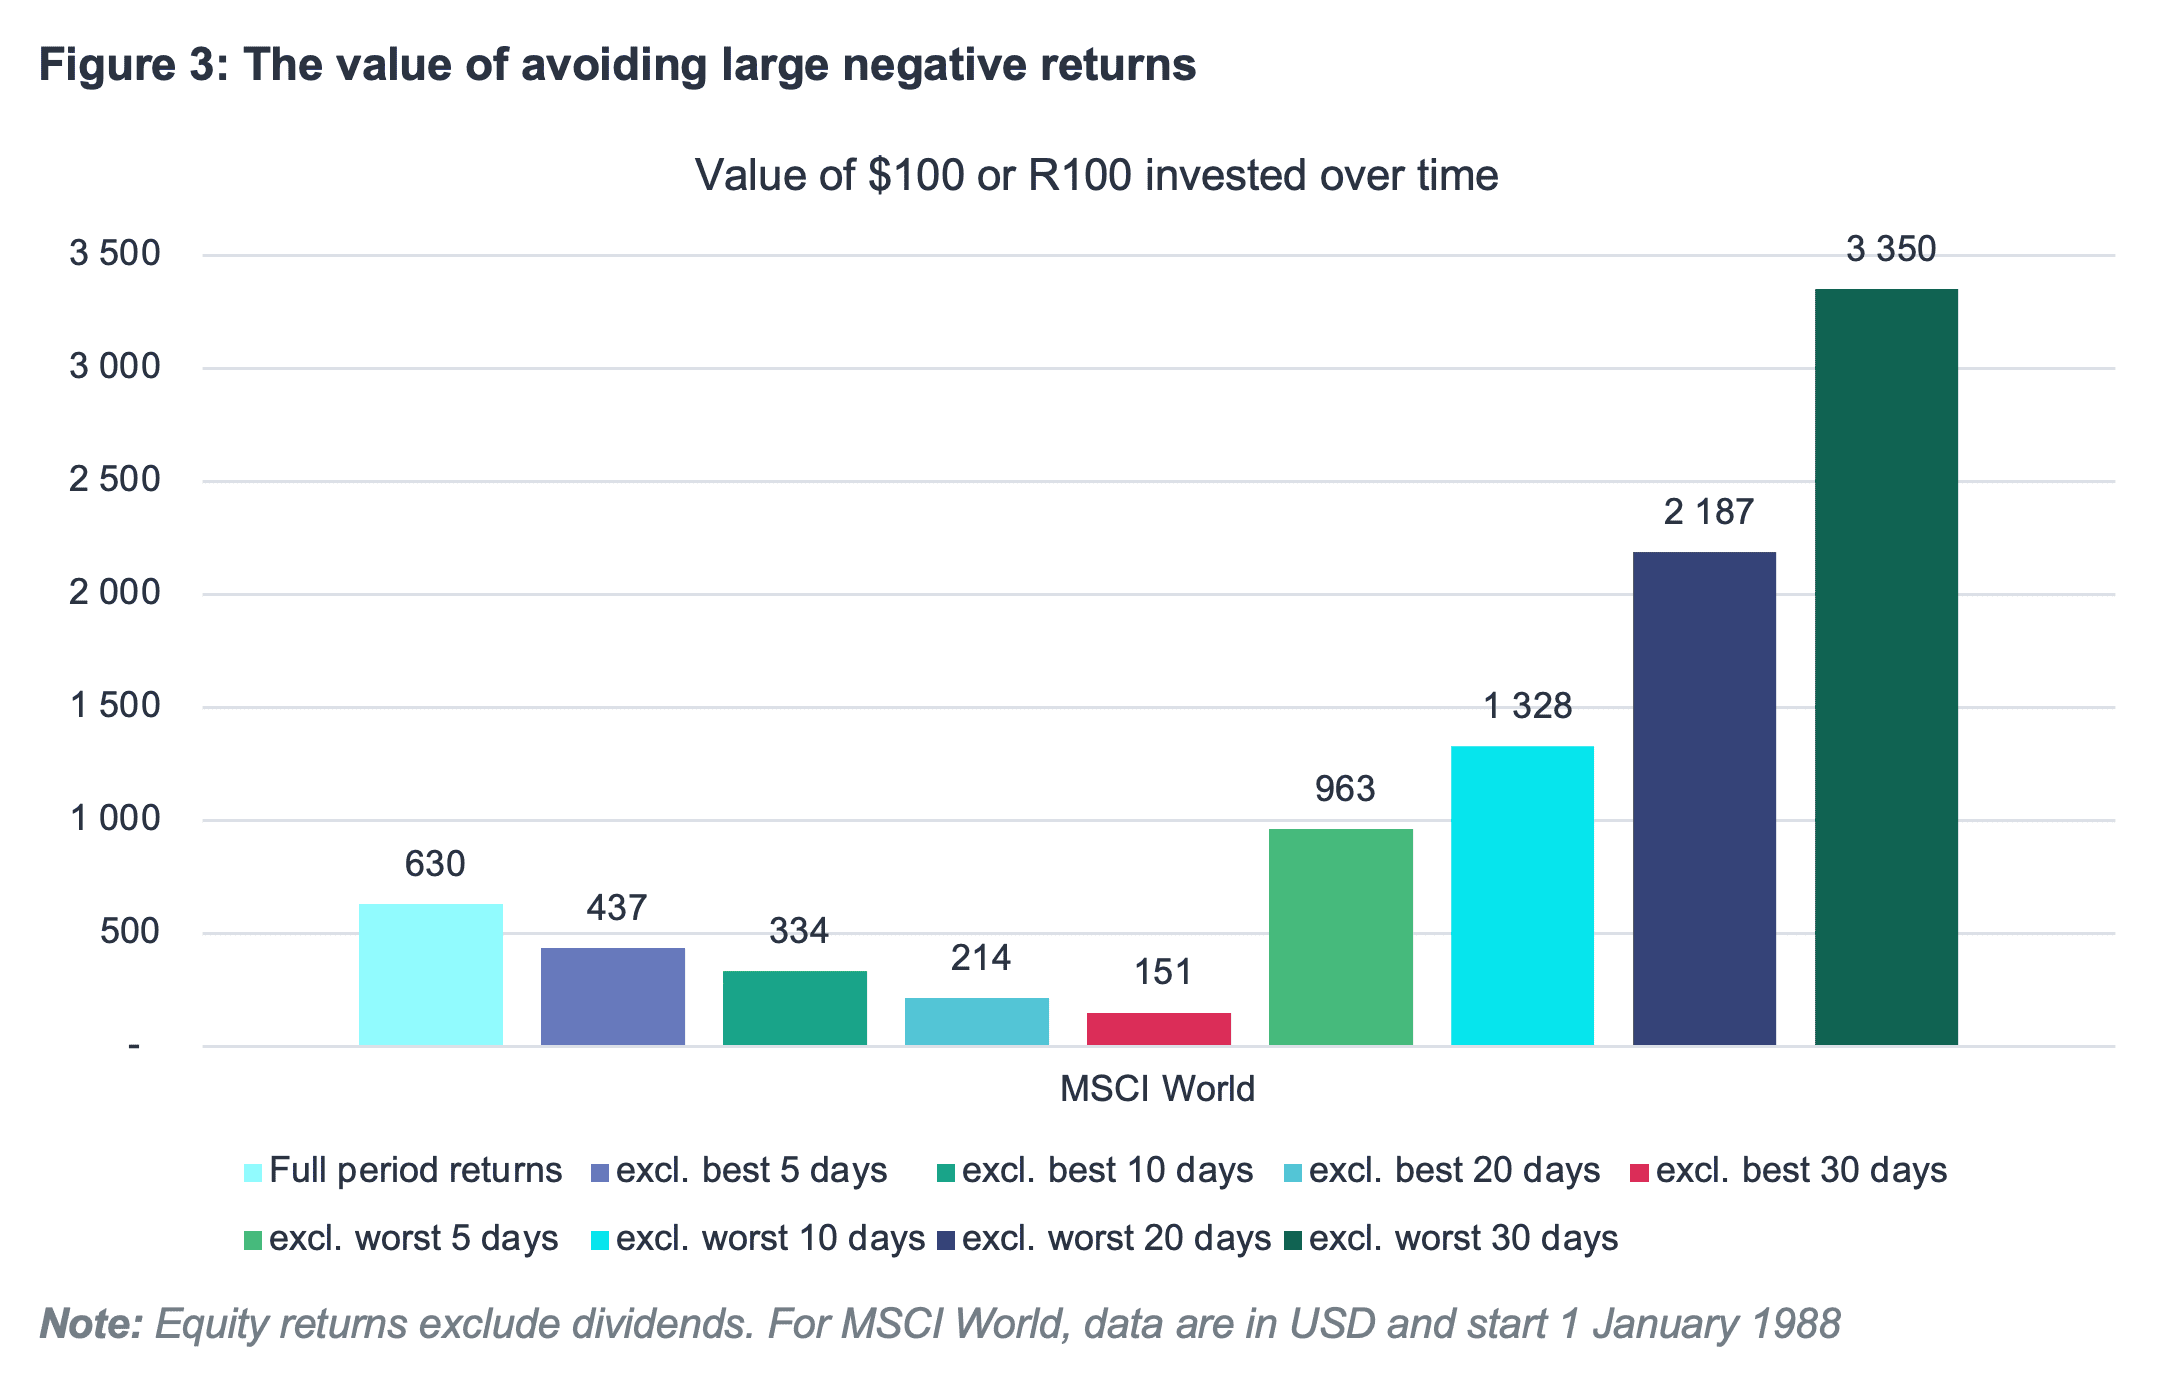
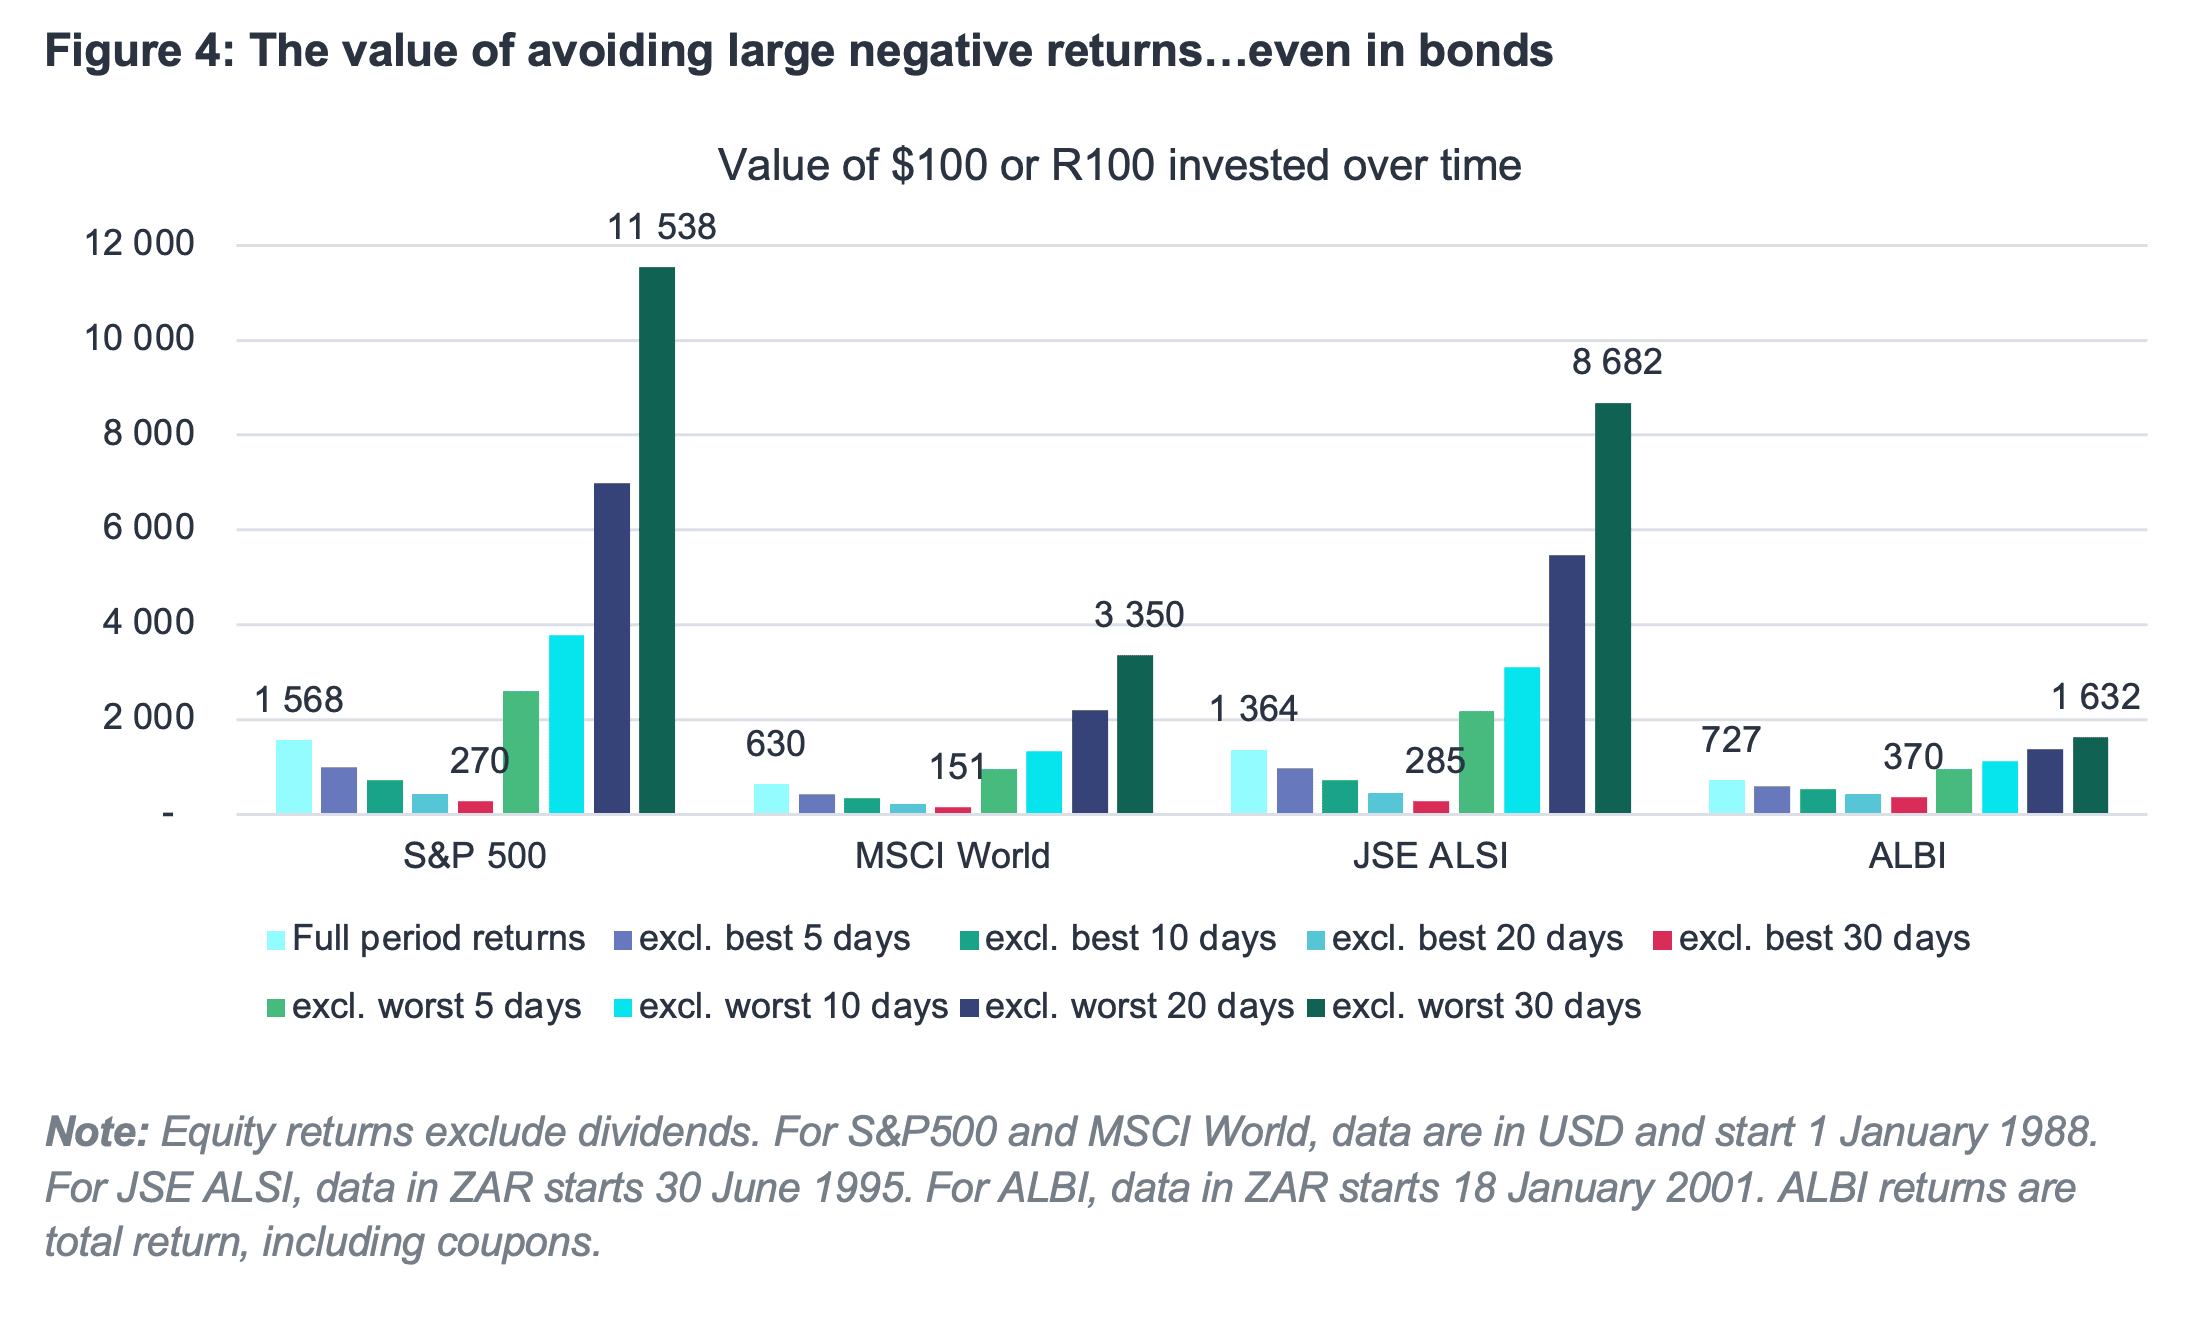
Figure 4 extends the analysis to the South African All Bond Index, showing that this asymmetry is not confined to equity markets. The result is intuitive, as the pendulum of mood swings between greed and fear affects all financial markets – at least for as long as humans are the dominant players. (As an aside, it will be fascinating to see how the age of Artificial Intelligence will impact the rhythm of financial markets.)
Figures 3 and 4 deserve a long look: for such a simple idea, the results are powerful. We revisit this concept later to devise an actionable strategy.
Returning to Myth 1, it is certainly true to say that missing out on the equity market’s strongest days would severely curtail long-term returns. However, if the objective is to maximise long-term returns, avoiding the worst days would add significantly more value. We conclude that the requirement to capture the market’s best days is not a sound argument for staying invested in equities. The fear of missing out (FOMO) is the wrong reason to stay long!
Is there a way of staying invested and avoiding the worst days? Practically, this is almost impossible, as the market’s best and worst days typically follow each other in quick succession.
Figure 5 shows that volatility tends to cluster. In other words, the market experiences volatility ‘regimes’, extended periods when daily volatility is consistently low or consistently high. Isolated large returns, either positive or negative, seldom appear during otherwise quiet periods. The practical difficulty of avoiding the worst days while still capturing the best days becomes obvious.
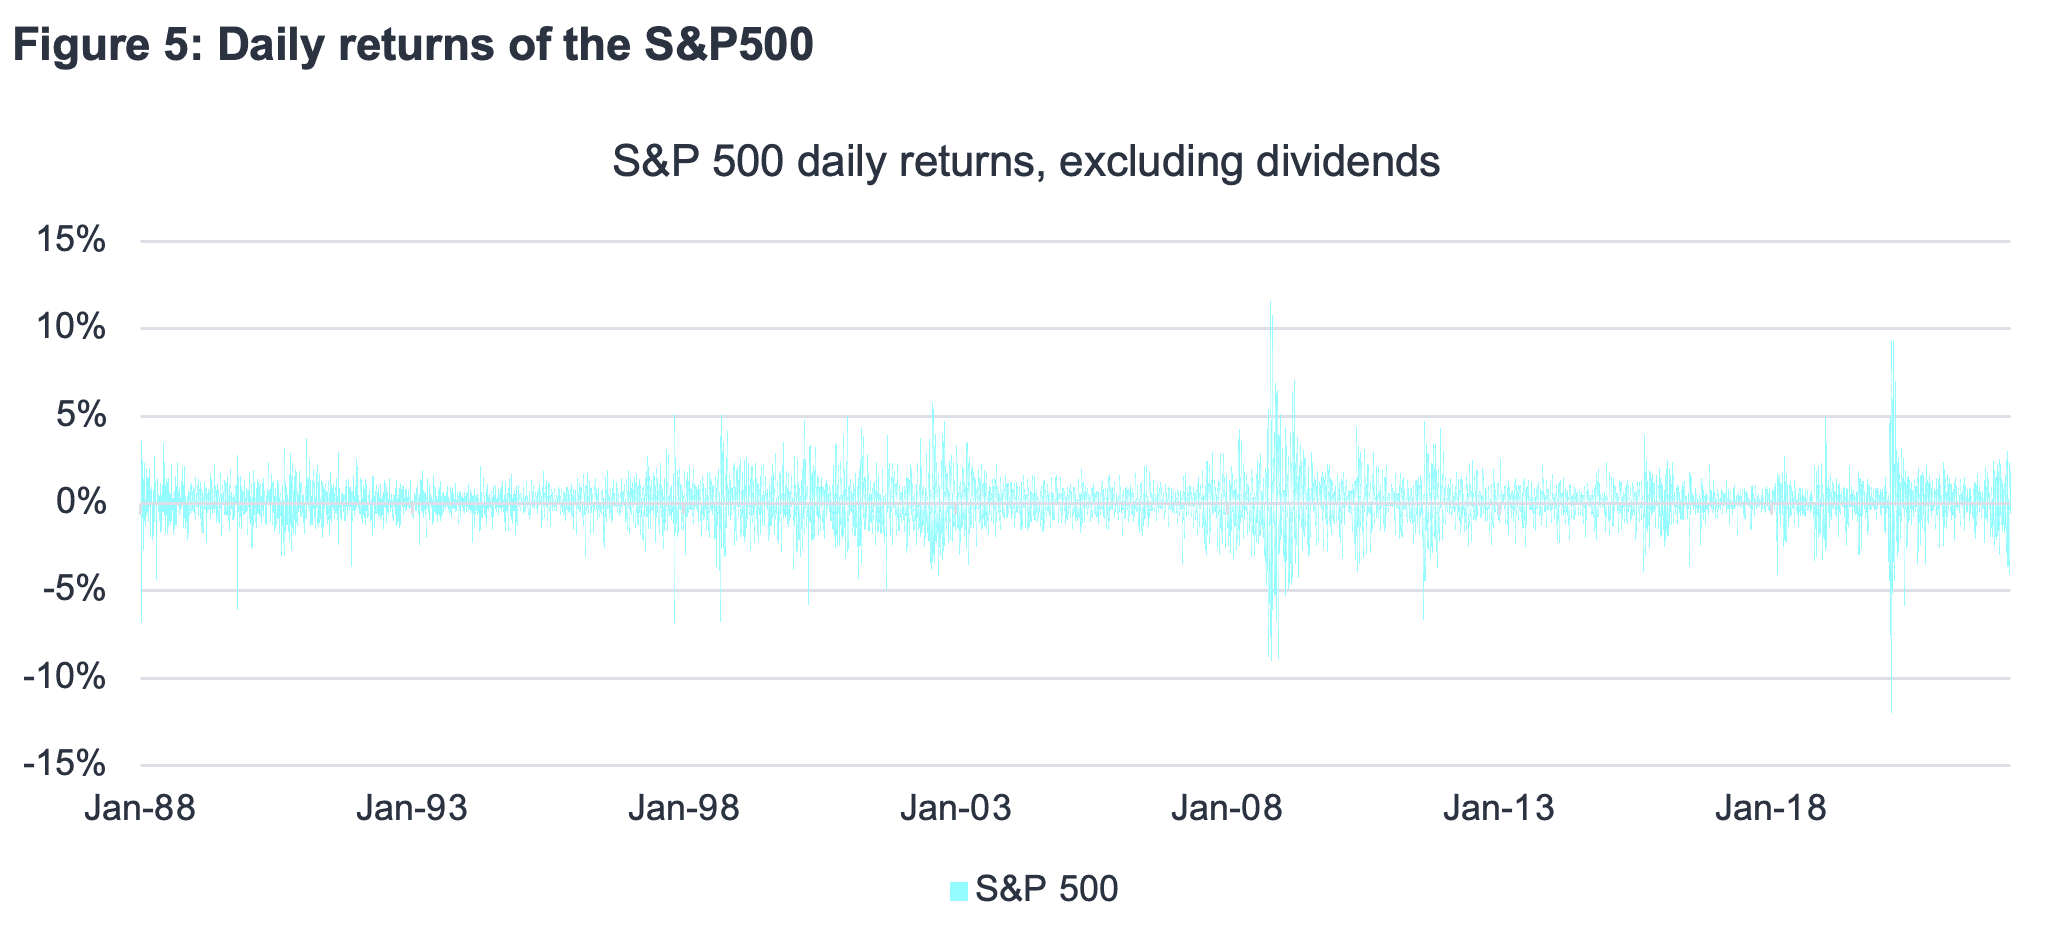
Here we have used the S&P500 to illustrate volatility clustering, but most, if not all, financial markets present a similar picture. Global capital markets are interconnected, with US markets being pre-eminent.
To summarize:
- Missing out on the market’s best days would harm long-term returns.
- Avoiding the market’s worst days would be significantly more valuable than capturing the best days’ returns.
- This phenomenon is not just limited to equity markets.
- It may well be in investors’ best interests to favour equities for the long term, but the often-touted requirement to capture the market’s best days is not a good enough reason to stay continuously fully invested. If you do the right thing but for the wrong reason, you’re lucky, not skilled.
So what are investors to do? Is there a systematic way to invest that reflects the realities summarised above? In short, is market timing even possible? This brings us to Myth 2
Myth 2: Market timing is impossible
We often hear statements from investment firms that consistent market timing is impossible. The phrase ‘time in the market, not timing the market’ has become ubiquitous. Like all great slogans it trips off the tongue and feeds human beings’ love of strong, simple narratives instead of dealing with a complex underlying reality. It also serves the asset management industry’s primary goal: to gather assets from investors and keep them for a long, long time. Unfortunately, it is not entirely true.
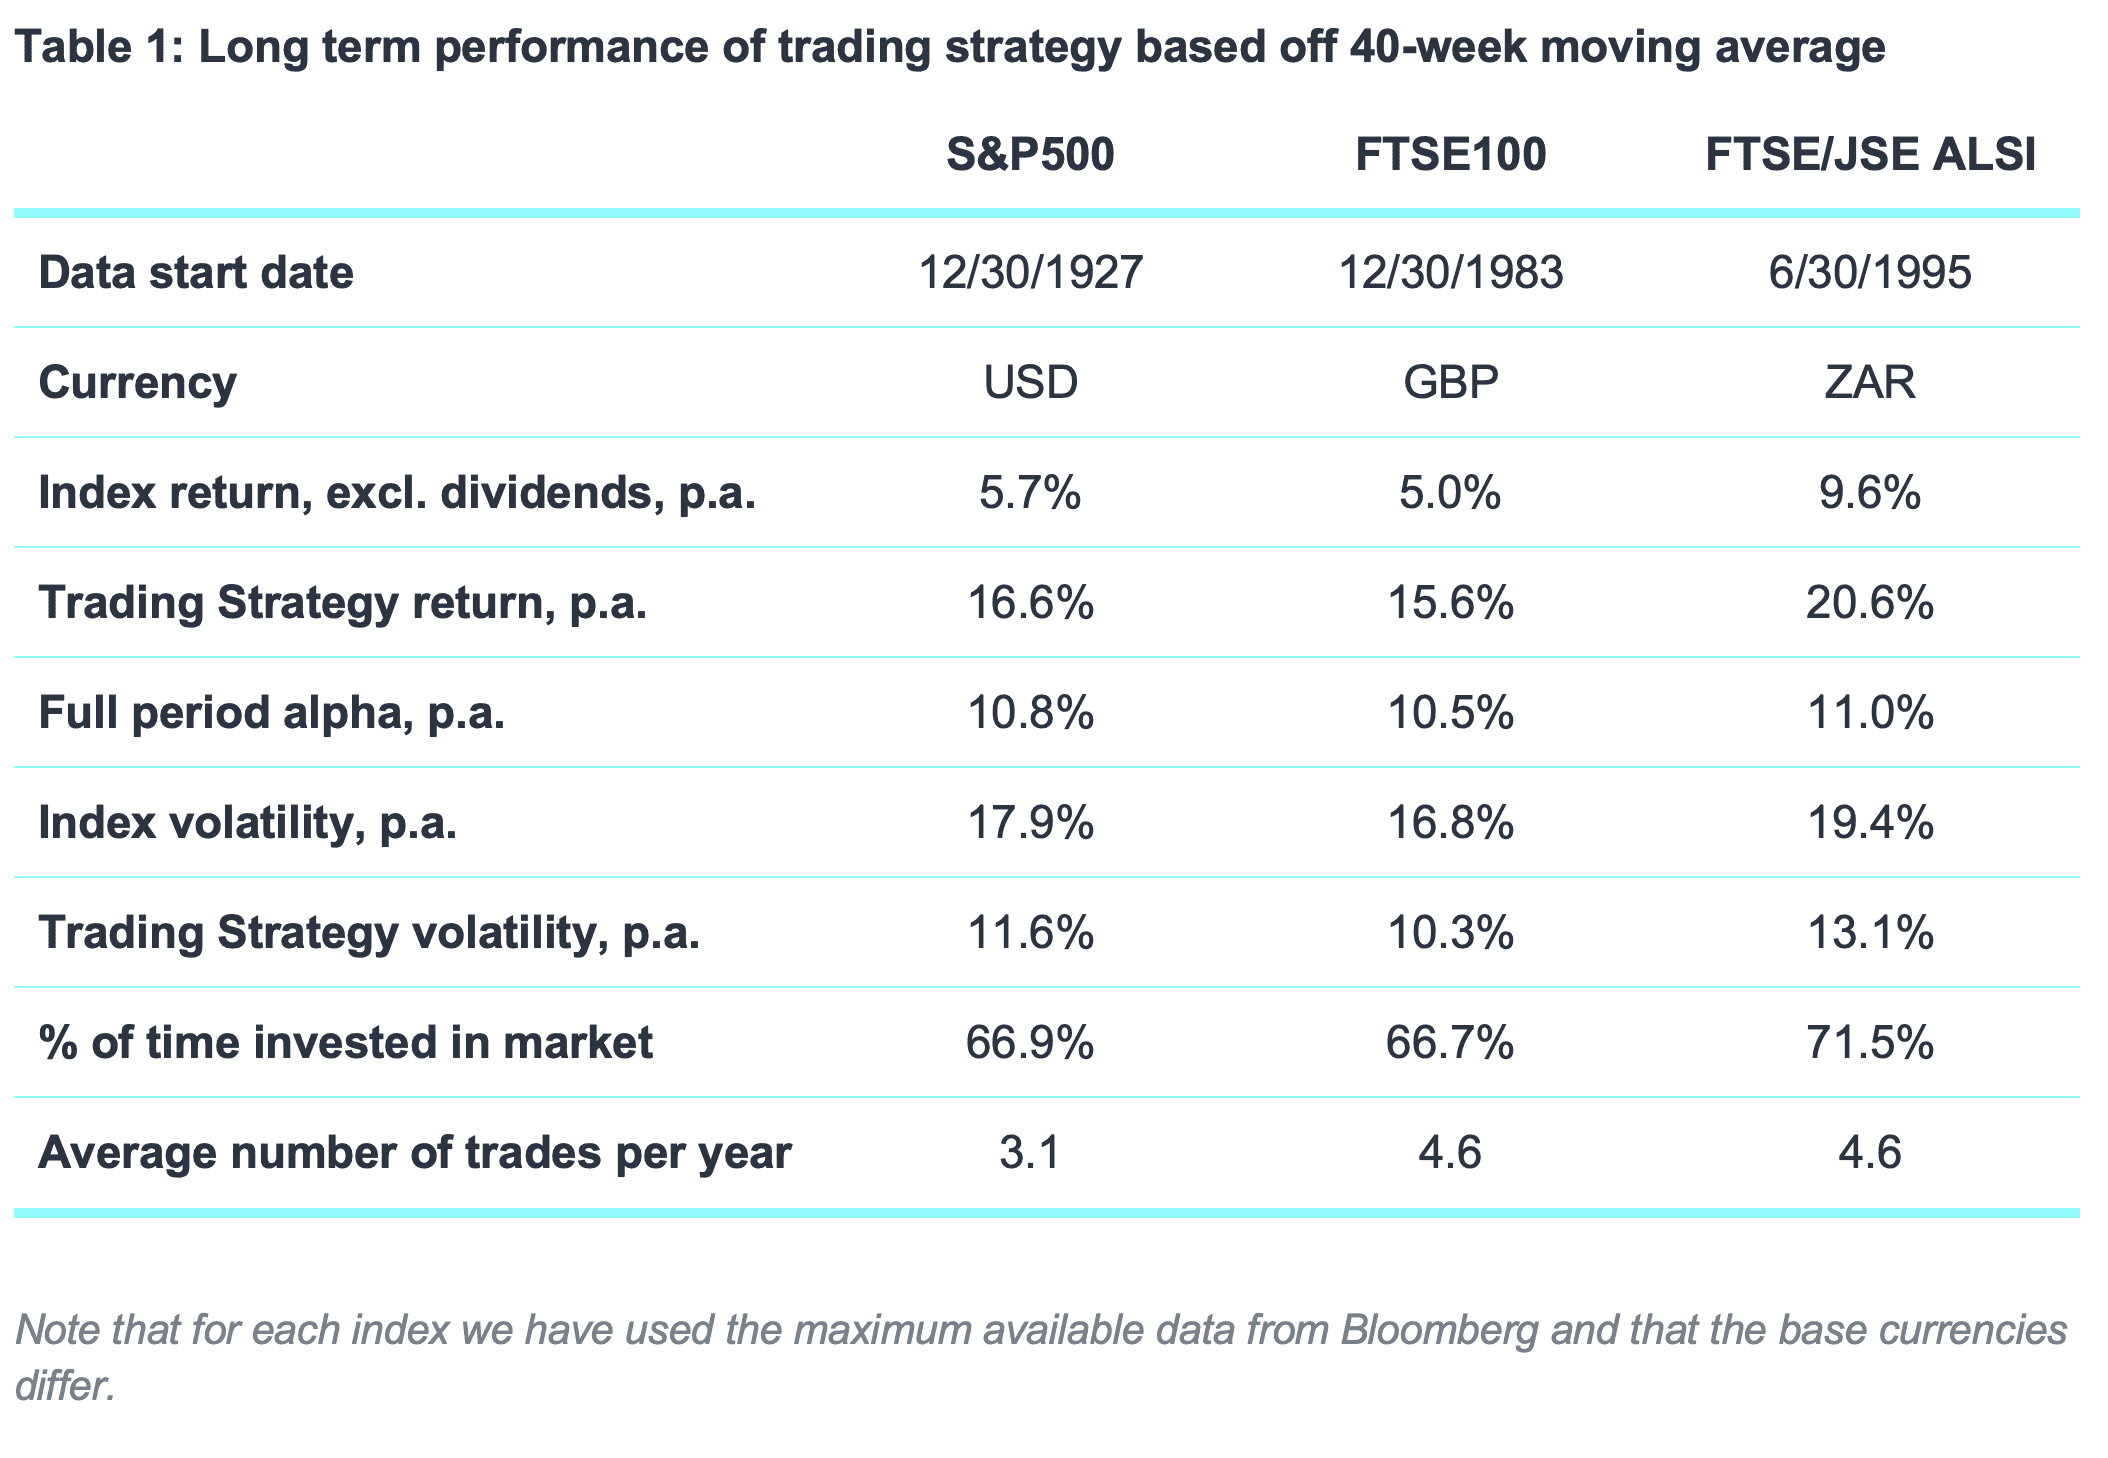
At STANLIB Multi-Strategy, we reject this comfortable but flawed consensus, and embrace market timing as a source of value-add for our clients. To illustrate, we might deploy a simple but effective momentum strategy; buying things which have already gone up and selling things which have already gone down sounds childishly simple (and even counter-intuitive) but it can work, if adhered to systematically. If we were to buy the market when it is trading above its 40-week, or 200-day, moving average (MA) and sell it when it declines below its 40-week MA, we would achieve the following results over time.
Calculation Methodology and Caveats
The figures above are indicative. To calculate an investor’s precise return using that strategy, we must make the following adjustments:
- Dividend income should be added to equity returns. Since the trading strategy is invested in equities roughly 67% of the time, 67% of dividend income should be added to the trading strategy returns. This reduces the alpha of the strategy by one-third of average dividend yields, or about 1% over time.
- In our calculations, the interest earned on cash held during the 33% of the time that equities have been sold has not been included. This increases alpha by one-third of average after-tax cash yields and would typically come close to offsetting the foregone dividend yield, although the effect of tax differs per investor type. Including the effects of dividends and interest should largely net off.
- No trading costs were included. Such a strategy is cheaper for professionals paying institutional brokerage rates and would reduce the alpha by less than 0.5% per year.
- A more active strategy would incur higher taxes for an individual, but not within pooled vehicles like unit trusts. The effects of tax are therefore excluded above.
With these adjustments made, the investor would realise a pre-tax return of about 10% a year in excess of the market itself (i.e. ‘alpha’). This sort of outperformance should turn the head of even the most sceptical and sophisticated investors. In practice there may be some implementation drag in not being able to always trade precisely at the 40-week MA, but even if this reduces the annualised alpha to 9%, the strategy remains compelling.
There is an additional benefit to following such a strategy: realised volatility is materially lower. This is a material benefit, especially for investors who are drawing down on their investments. For these investors the sequence of returns can – within reason – matter more than the quantum of returns. For our Multi-Strategy funds, when we refer to ‘high quality’ returns, this is the sort of profile we want to generate.
Observations/Implications
Market timing is not only possible but can be hugely profitable. It can also be deployed using relatively simple concepts.
Understandably, investors seek to minimise trading costs as it is one of the few variables they can control. However, what is often ignored is the value that can be bought with those higher costs. As an equity investor, i.e. a risk-taker, you should be willing to pay a certain 0.5% trading cost for a potential 9% alpha gain, especially when historical data indicates that such a strategy has yielded reasonably consistent results for almost a century. Investors must capitalise on opportunities where, on balance, the outcome is skewed in their favour.
If markets are at all efficient, why is such a simple, massively value-adding strategy not universally pursued? Figure 5 may provide a clue: the strategy can significantly underperform over one-year periods.
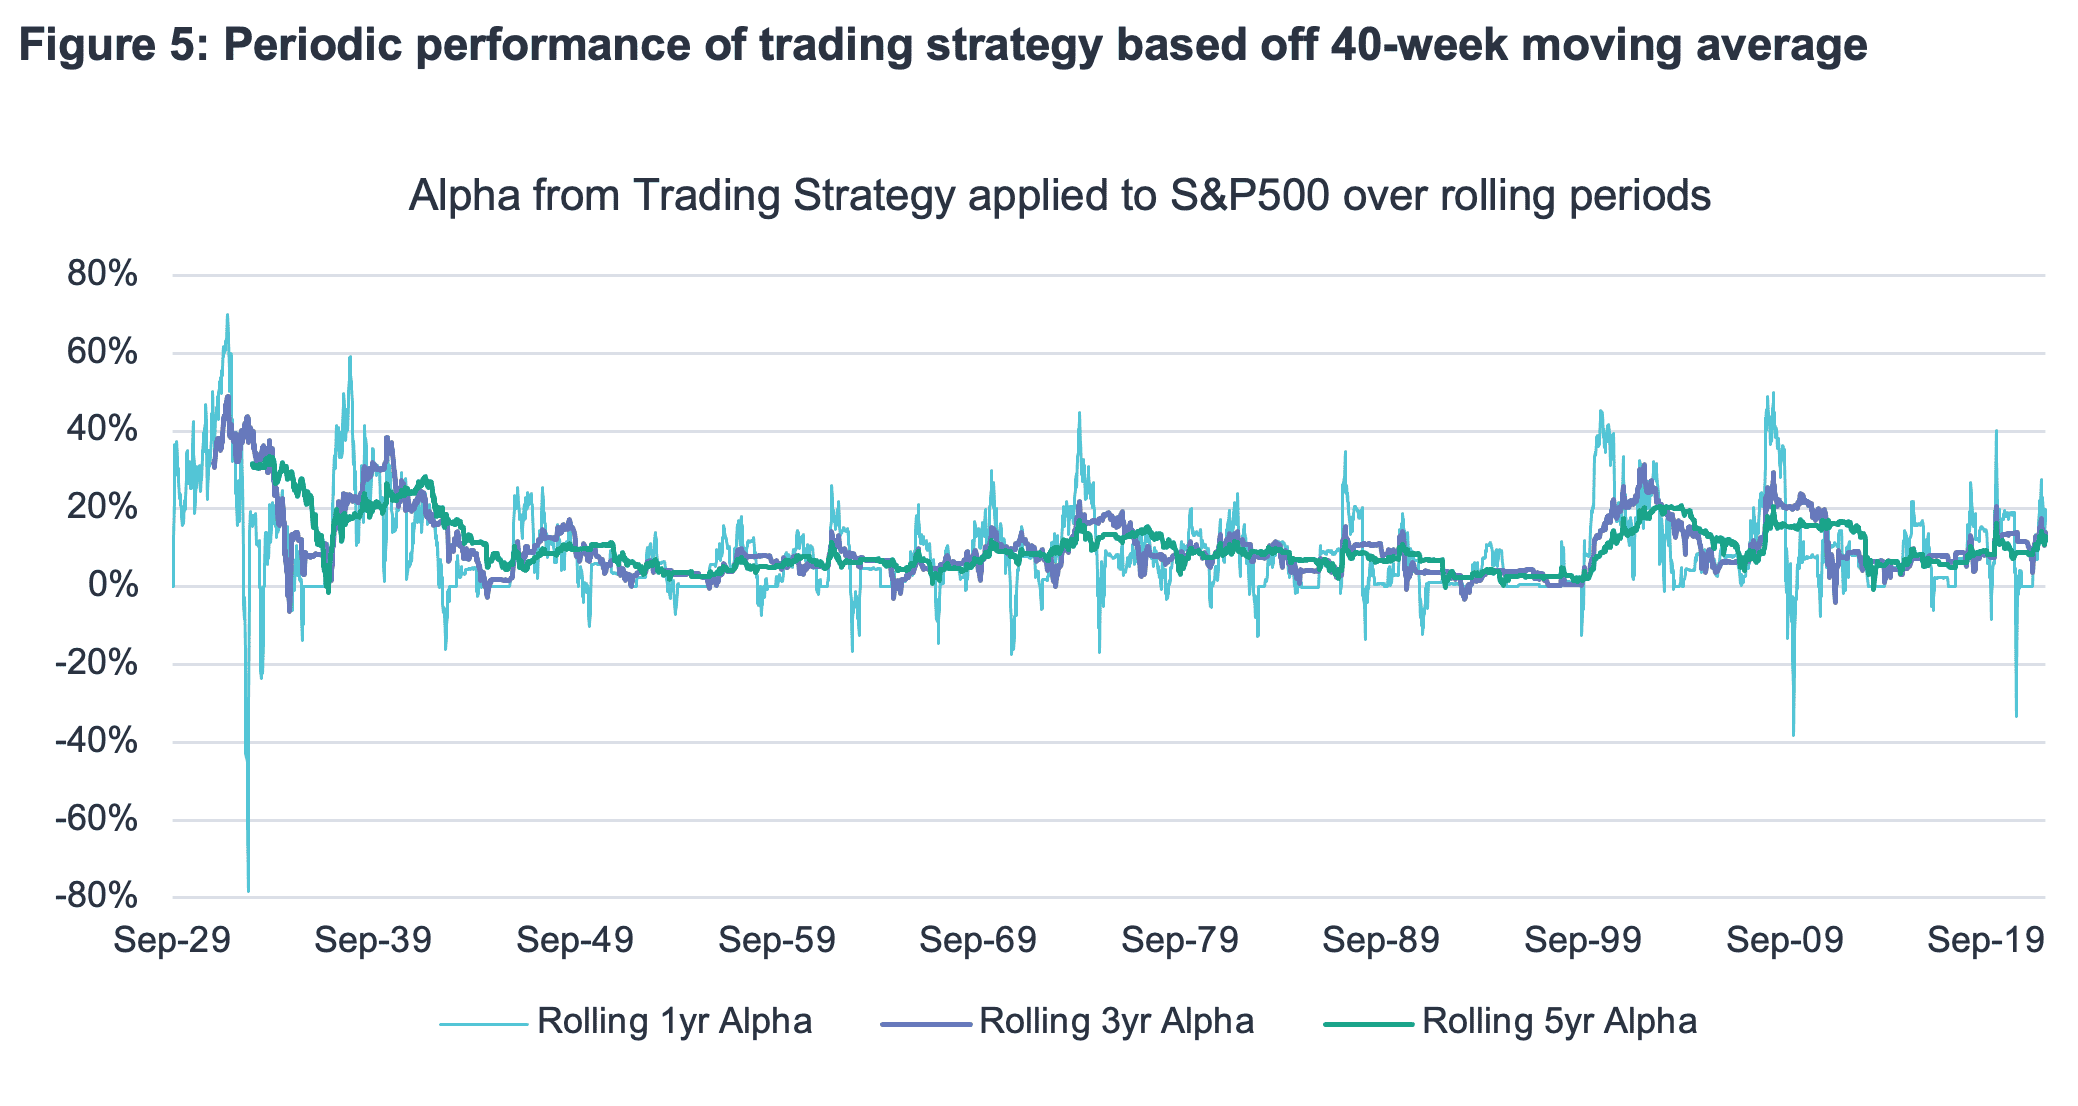
Given that the 40-week moving average is essentially a slow-moving measure of momentum, the trading strategy underperforms when markets reverse direction aggressively over relatively short time periods. Note that Figure 5 shows alpha. The worst 12-month alpha outcome was in the year ended July 1933, when the S&P500 returned 171%, versus 93% for the trading strategy, the difference being -78% alpha.
The minimum 12-month return (note return, not alpha) from the trading strategy was -9.7% for the year ended June 1934, whereas the 12-month minimum from remaining invested in the S&P500 was -70% in 1932. In more recent times the two instances of large underperformance (negative alpha) were a year after the 2009 GFC low and the 2020 Covid low. In those events the trading strategy returned 29% and 36% respectively, but it lost ground to strong equity markets that were bouncing off their lows.
Interestingly, both the 2009 and 2020 lows were followed by sharp rallies which were fuelled by unprecedented levels of monetary and fiscal support. Perhaps investors like staying invested as they trust that policymakers will always come to their rescue?
This suggests that, once again, greed, or the fear of missing out on short-term upside prevents investors from following strategies that add significant value over the medium to longer term. As professional investors, we can use models like this trading strategy as prompts to ensure that logic and the indisputable algebra of compounding prevail over emotion.
While it is impractical to attempt to avoid the worst days whilst still capturing the returns of the best days, there is still an actionable idea based on the asymmetry seen in Figure 3. Systematic market timing is that idea.
Conclusion
The key lessons from the above are:
- Question your assumptions, check the facts and improve your chances that your investment outcomes are due to skill, not luck. If you are going to stay fully invested in equities, do so for logically sound, not emotive reasons.
- Successful market timing is possible, but investors need to be disciplined. A quantitative approach like the strategy described here must be followed systematically, without allowing emotions to override model-driven signals.
At STANLIB Multi-Strategy, we employ a multi-faceted, style-agnostic approach to investing. We look for proven strategies like the one outlined in this paper and combine them with complementary – ideally diversifying – strategies to generate high-quality risk-adjusted returns for our investors.
In everything we do we try to keep Mark Twain’s profoundly wise observation in mind: it takes deliberate effort to overcome our species’ appetite for simple narratives and to keep questioning our assumptions. Any investor with the intellectual curiosity to do so may find lucrative investment strategies hiding in plain sight.